
Extractive Industries Data Ecosystem: A Database of Available Data Tools for the Natural Resource Governance Sector
One of the principal aims of the Natural Resource Governance Institute (NRGI) research and data team is to encourage and facilitate the use of data to promote accountability and transparency. To that end, the team is developing a suite of data tools to collect, analyze and present publicly available data in a user-friendly manner.
NRGI is not alone in its efforts to promote the use of data for advocacy, decision-making and, ultimately, governance. Myriad web portals, projects and data tools already exist, but these instruments have now been catalogued and compiled in an NRGI database, making it easier than ever to compare projects and access tools.
The full catalogue can be downloaded here.
Our search was built on preexisting efforts. In 2011, the Transparency Policy Project published a report about the role of digital technologies in promoting transparency and accountability initiatives in the natural resource governance sector. And today, civil society projects making use of data-focused technologies have increased substantially, thanks to efforts by the World Bank, United Nations and G8 to promote open data for development.
In light of these developments, NRGI has updated the above mentioned report with the most recent projects in the oil, gas and mining sectors led by civil society organizations, independent researchers from academia, governmental and private for-profit initiatives.
|
The Extractive Industries Data Ecosystem What
Where
Who
|
The structure of the extractive industry’s data can be described as an ecosystem. Very often, tools present similarities in the way in which they deploy the same data source, while building diverse products. On the other hand, some of the projects use the same type of visualization, while using completely different types of data.
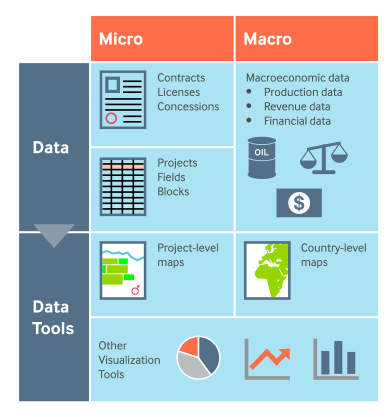
In the extractive sector, data are mainly of two types. Macro data are collected at the country level, mostly originating from governmental sources or online databases (e.g., the World Bank Data portal). The most common type of macro data used for this scope is a combination of production and revenue data. Tools based on this type of data are usually interactive world maps or other visualization tools comparing resource production indicators with development or transparency indicators.
Micro data relate to projects, blocks, fields, and concessions, usually collected as spatial information, often made available by governmental websites through cadastral maps. Micro data tools often add interactive layers linking socioeconomic and environmental indicators to resource projects.
On the other hand, data found in contracts, company and EITI reports are often not geocoded and matched with projects. This might be due to the fact that their release is based on voluntary actions of disclosure or enforcing authorities and regulations. Lacking linked, easily accessible primary data, data tools are burdensome to develop. Nonetheless, they can be most valuable in promoting transparency at the project level in extractive industries.
Indeed, this is the type of data tool NRGI is working on.
The ecosystem database was built to have an overview of the data tools in the oil, gas and mining sector. At NRGI, the research and data team will use it to learn from others, build on it, find ways to collaborate and explore innovative approaches.
The ecosystem will be updated regularly. Please feel free to send suggestions or updates to me at [email protected] or @gio_cek.
Giorgia Cecchinato is a research and data associate at NRGI.
