Public Payment Data Reveal Practical Challenges in Taxing Mining Companies in Africa: A Guinea Case Study
In this two-part series, I share insights from publicly available Extractive Industries Transparency Initiative datasets on payments made by mining companies to the governments of Guinea and the Democratic Republic of Congo. (Read the DRC post here.)
Both countries have been publishing EITI reports for about a decade. Both have made important efforts toward increased transparency in their mining industries, including by publishing mining contracts on dedicated platforms.
Do their disclosures offer any valuable lessons?
I think they do. These two examples in particular show some companies pay significant amounts of taxes. Which taxes they pay, how, when and why is a lot more complex than what was foreseen by the formal legal framework. I initially presented these examples at a conference dedicated to international taxation challenges faced by African countries organized by the International Monetary Fund on the last day of the 2019 Spring Meetings. I hope it helped to show how publically available data can make complex taxation debates more concrete and context-specific.
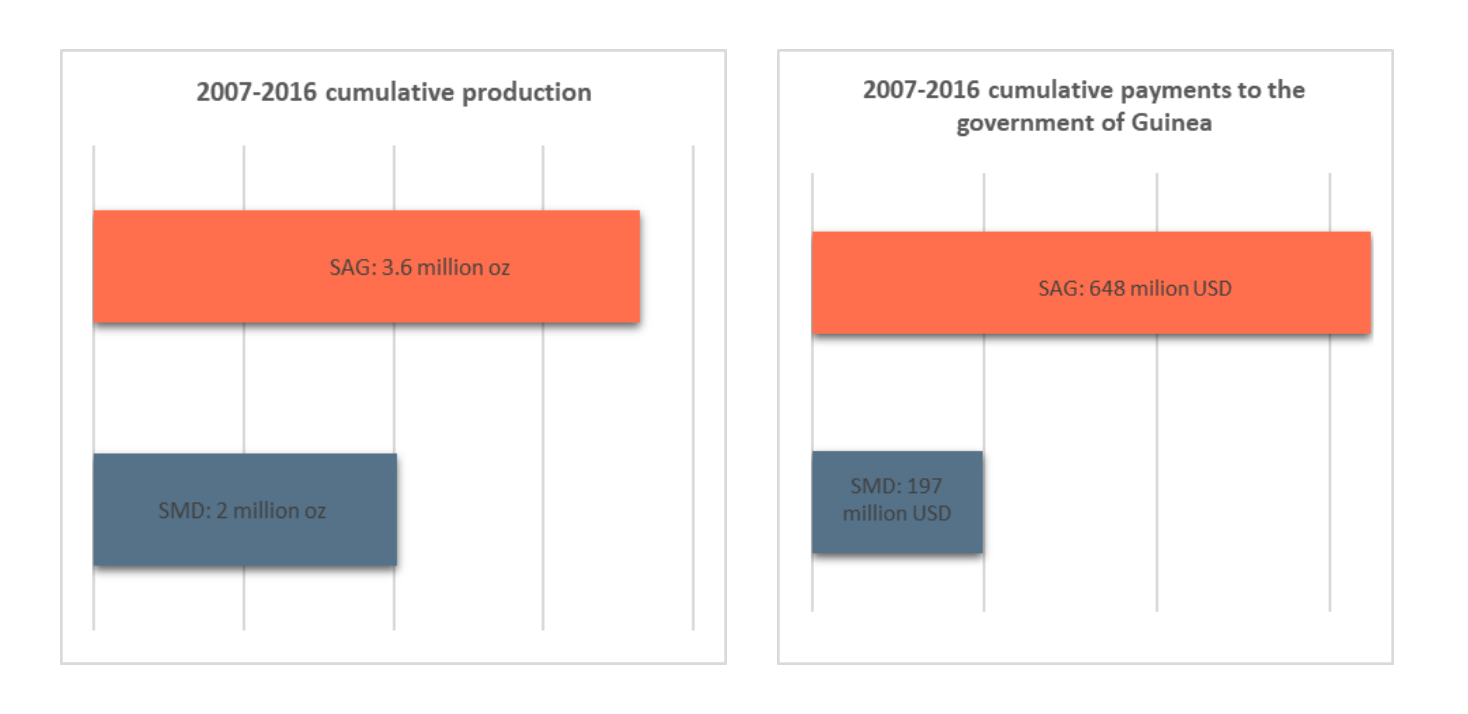
In Guinea, I compared payments data for 10 years of exploitation of two gold mines, Société Miniere de Dinguiraye (SMD), operated by Nordgold, and Société Aurifère de Guinée (SAG), operated by Anglogold Ashanti. The two mines are the only ones currently producing gold in the country at an industrial scale. The projects are located in the North East region of “Haute Guinée” bordering Mali and have been operating since the 1990s. Production data for each mine can be collected from Anglogold Ashanti’s and Nordgold’s websites, including their past annual reports. For this analysis I had access to consolidated historic production profiles from S&P Global. Both projects have been subject to similar fiscal terms (a 5 percent royalty on gold exports over a certain price threshold and a 30 percent corporate income tax, as described in their original mining agreements). In Figure 1, we can see that between 2007 and 2016, SAG cumulatively produced 3.6 million ounces (oz) of gold, or 80 percent more than SMD, at 2 million oz. However, in the same period of time, SAG contributed USD 648 million to the Guinean government in various payments, more than three times (228 percent) as much as SMD (USD 197 million).
Figure 1

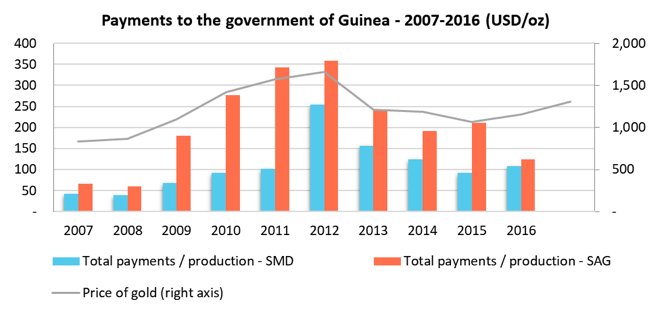
To better understand what each company has been contributing to the government, I then divided their total annual payments by their respective annual production, to obtain an average annual contribution per ounce of gold produced. Figure 2 shows the results, as well as the average annual price of gold over that period. It confirms that SAG has been contributing a lot more to the government of Guinea than SMD for each ounce of gold produced. This is especially true during the “boom years” for gold—from 2009 to 2012.
Figure 2

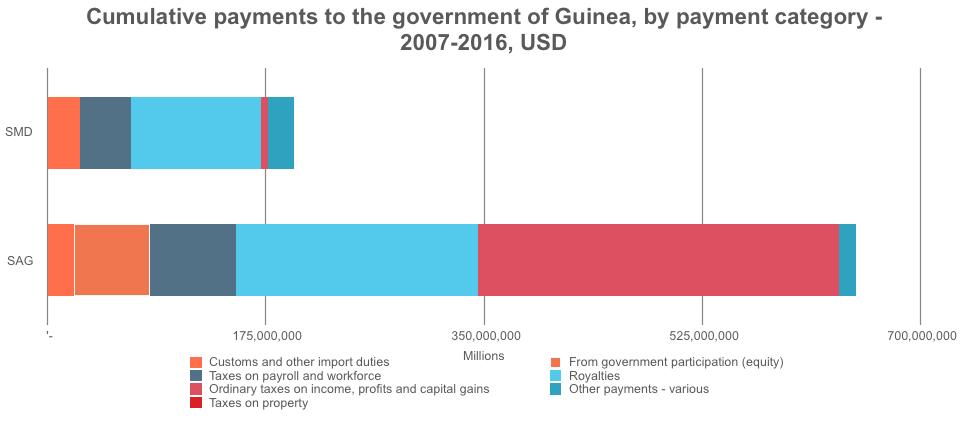
I then looked at the different types of payments made by each company to see if that breakdown would explain the divergence between their payments per ounce of production. Figure 3 shows the cumulative payments made by SAG and SMD to the government of Guinea, this time disaggregated by fiscal instrument. Both companies pay royalties, taxes on payroll and custom duties. SAG has paid some dividends to the government, which has a 15 percent minority equity stake in the project. But the major difference is the large amount of corporate income tax paid by SAG, which represents 45 percent of its total payments over the period. SMD has barely paid any income tax.
Figure 3

This example shows that despite well-known challenges with collecting corporate income tax in developing countries, some mines pay significant amounts of it. However, other companies spend years exporting precious commodities without paying much income tax. Are there notable diffences between the two mines that could explain the different outcomes? I identified three areas worth examining:
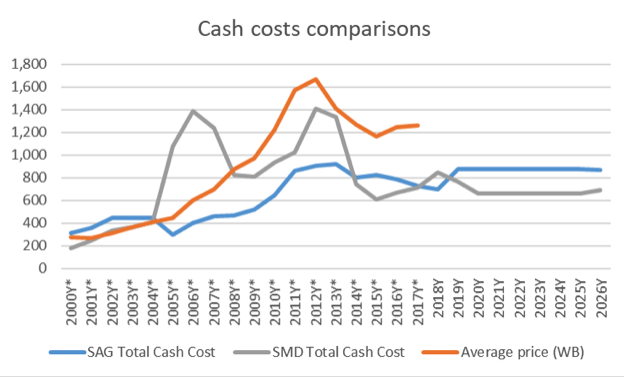
- According to data from S&P Global reported by the respective companies, shown in Figure 4, SMD has been reporting much higher cash costs than SAG until 2017. The average cash cost for SAG over the period 2007-2016 has been USD 743/oz, but USD 966/oz for SMD. SMD also records a much higher level of capital expenditure, especially in 2006, so that the all-in cost of SMD over the period has been USD 1,293/oz, compared with USD 887/oz for SAG. This raises additional questions worth investigating: were the two mines fundamentally different? Were the gold deposits of SAG being mined at lower costs than SMD’s because of natural factors? Was SMD less efficient than SAG in mining gold? Or is there any reason to probe whether SMD was inflating its costs and/or shifting its profits outside of the country through related party transactions?
- Guinea has a 15 percent minority share of SAG. It divested its 15 percent share in SMD in 2006 and only resumed its minority ownership in 2018, after a renegotiation of its mining agreement. In addition to a small amount of dividend payments, did that minority ownership contribute to making SAG declare more profits in Guinea? Did it contribute to additional government scrutiny of the company’s operations? Or did it increase trust between Guinea and SAG operator Anglogold Ashanti, often a key aspect of effective tax policy?
- Finally, are SAG and SMD behaving differently in their cost and tax reporting because of different standards adopted by the two multinational companies? Anglogold Ashanti has made concrete commitments to governance and transparency best practice through its ICMM membership and scores highly on the Responsible Mining Index. Nordgold’s public commitments to corporate social responsibility, by contrast, are limited to a page on its corporate website devoted to sustainable development.
Figure 4

While these reflections are not conclusive, they can be the basis for further analysis and even a few suggestions to Guinean authorities:
- As both SAG and SMD expand their operations within their respective concessions, including through investments in additional mining capacity, the ministry of mines could review investment plans and cost projections in detail, and benchmark them with industry standards. The costs incurred in the next few years will weigh on potential future coporate income tax.
- Given SAG’s important tax contributions in the past, the ministry of finance or budget should assess the fiscal cost (tax expenditure) of the five-year income tax exemption that SAG was granted in its revised 2016 agreement, which will kick in at the beginning of its next production phase. This may have important implications for medium-term budget planning.
- The ministry of mines and the state-owned miner SOGUIPAMI should assess how the government equity on SAG might have improved the company’s behavior as a taxpayer, and apply these lessons to SMD and other mining projects where the state has an ownership interest.
- The ministry of mines could require that all mining companies sign and abide by a code of conduct, as provided by Article 155 of Guinea’s mining code, that includes strong commitments in payment transparency and corporate social responsibility.
I probe a case study from the Democratic Republic of Congo next week, on Wednesday, 5 June.
Thomas Lassourd is a senior economic analyst with the Natural Resource Governance Institute (NRGI).
