
Lost Wealth in Senegal's Mining Sector

NRGI senior economic analyst William Davis appeared on West Africa Democracy Radio (WADR) to discuss and explore key findings from the NRGI report Tax Avoidance, Tax Evasion and Trade Misinvoicing: Risks to Senegal’s Mining Sector. Among his remarks, he said:
Tax avoidance is legal strategies that companies use to reduce their tax bill. Tax evasion is when taxpayers hide incomes from tax authorities or lie about their taxable income, which is illegal. Trade misinvoicing can be a type of tax avoidance or tax evasion or motivated by other illicit motives such as money laundering or hiding illicit wealth overseas. Trade misinvoicing is distorting what is declared to customs about the value of goods or services that are being traded internationally.
Published under USAID/TRACES program, this report highlights critical risks in Senegal’s extractive sector, emphasizing the need for transparency and accountability to safeguard national revenues. Tune in to learn more about the report’s impact and recommendations for Senegal’s economic resilience.
Tune in
Listen to the full interview at the West Africa Democracy Radio (WADR) and explore how stronger fiscal oversight could ensure that Senegal’s natural resources contribute meaningfully to national development.
Notes
-
1
International Energy Agency, The Role of Critical Minerals in Clean Energy Transitions (2021), www.iea.org/reports/the-role-of-critical-minerals-in-clean-energy-transitions.
-
2
In this report we refer to both Africa north and south of the Sahara. When we mean one of the sub-regions we specify as such.
-
3
IEA (2021); Clyde Russell, “Mining is key to energy transition, but it’s still unloved,” Reuters, 11 May 2022, www.reuters.com/business/energy/mining-is-key-energy-transition-its-still-unloved-russell-2022-05-11; Jairo Yunis and Elmira Aliakbari, Annual Survey of Mining Companies 2020 (Fraser Institute, 2021), www.fraserinstitute. org/studies/annual-survey-of-mining-companies-2020.
-
4
See, for example, Natural Resource Governance Institute, Natural Resource Charter 2nd edition (2014), resourcegovernance.org/approach/natural-resource-charter.
-
5
Natural Resource Governance Institute, Resource Governance Index: From Legal Reform to Implementation in Sub-Saharan Africa (2018), resourcegovernance.org/sites/default/files/documents/rgi-from-legal-reform-to-implementation-sub-saharan-africa.pdf.
-
6
Africa Climate Foundation, Geopolitics of Critical Minerals in Renewable Energy Supply Chains (2022), africanclimatefoundation.org/news_and_analysis/geopolitics-of-critical-minerals-in-renewable-energy-supply-chains/.
-
7
See for example, Cooper Inveen, “Atlantic Lithium’s Ghana mine poised to being production by 2024,” Reuters, 20 September 2022, www.reuters.com/article/ghana-mining-lithium/atlantic-lithiums-ghana-mine-poised-to-begin-production-by-2024-idUSKBN2QV0NQ?utm_source=substack&utm_me….
-
8
As demonstrated by recent discussions between a U.S.-led group of rich countries and mineral producers such as the Democratic Republic of Congo, Namibia and Tanzania. Julian Pecquet, “US looks to Africa to
diversify supply chain for critical minerals,” The Africa Report, 23 September 2022. www.theafricareport.com/243847/us-looks-to-africa-to-diversify-supply-chain-for-critical-minerals. -
9
Glada Llahn and Paul Stevens, The curse of the one-size-fits-all fix, UNU-WIDER Working Paper (United Nations University, 2017), www.wider.unu.edu/sites/default/files/wp2017-21.pdf. For further assessment of donors’ activities in the past, both positive and negative lessons, see: Joanna Buckley, Neil McCulloch and Nick Travis, Donor-supported approaches to improving extractives governance, UNU-WIDER Working Paper (United Nations University, 2017), www.wider.unu.edu/sites/default/files/wp2017-33.pdf; Siân Herbert and Laura Bolton, Donor activity in the extractives sector (Knowledge, evidence and learning for development, 2018), opendocs.ids.ac.uk/opendocs/bitstream/handle/20.500.12413/13589/Donor_activity_in_the_extractives_sector.pdf.
-
10
Although this estimate includes emissions resulting from the investments by each group. Lucas Chancel, “Global carbon inequality over 1990–2019,” Nature Sustainability (2022), doi. org/10.1038/s41893-022-00955-z.
-
11
For Further reading on this dilemma and the arguments between the proponents of “green growth” and “degrowth, see: Alex Bowen and Samuel Fankhauser, “The Green Growth Narrative: Paradigm Shift or Just Spin? Global Environmental Change-human and Policy Dimensions,” Global Environmental Change, 21 (2021), 1157-1159, DOI: I:10.1016/j. gloenvcha.2011.07.007; Kate Raworth, Doughnut Economics: Seven Ways to Think Like a 21st Century Economist, Random House Business Books, London, 2017; Jason Hickel, “What does degrowth mean? A few points of clarification,” Globalizations, 18:7 (2021), 1105-1111, DOI: 10.1080/14747731.2020.1812222.
-
12
McKinsey & Company, “The raw-materials challenges: How the metals and mining sector will be at the core of enabling the energy transition” (2022), www.mckinsey. com/industries/metals-and-mining/our-insights/the-raw-materials-challenge-how-the-metals-and-mining-sector-will-be-at-the-core-of-enabling-the-energy-transition.
-
13
McKinsey & Company, “Metal mining constraints on the electric mobility horizon” (2018), www.mckinsey.com/industries/oil-and-gas/our-insights/metal-mining-constraints-on-the-electric-mobility-horizon.
-
14
McKinsey (2018)
-
15
NRGI analysis, based on Net Zero Tracker. “Net Zero Tracker,” Energy and Climate Intelligence Unit, Data-Driven EnviroLab, NewClimate Institute, Oxford Net Zero (2022), zerotracker.net
-
16
Pratima Desai, “Low carbon world needs $1.7 trillion in mining investment,” Reuters, 10 May 2021, www.reuters.com/business/energy/low-carbon-world-needs-17-trillion-mining-investment-2021-05-10/
-
17
Based on S&P Global Market Intelligence data and U.S. Geological Survey, Mineral Commodity Summaries 2022, 2022, www.pubs.er.usgs.gov/publication/mcs2022. These sources sometimes differ significantly. An average is taken when the reported amounts are similar. When they are not, a third source is used to determine which is likely to be more accurate.
-
18
NRGI analysis based on reserves reported in the S&P Globaldatabase and U.S. Geological Survey (2022), and the mineral volumes in a standard electric vehicle in IEA (2021).
-
19
See for example, World Bank, “New World Bank Survey Brings Hope to Malawi’s Mineral Potential,” 22 September 2015, www.worldbank.org/en/news/feature/2015/09/22/new-world-bank-survey-brings-hope-to-malawis-mineral-potential.
-
20
International Energy Agency, Global Supply Chains of EV Batteries (2022), www.iea.org/reports/global-supply-chains-of-ev-batteries.
-
21
African Minerals Development Centre (AMDC), “Unveiled: The #AMDC’s Theory of Change: A prosperous and transformed Africa achieved through sustainable development of mineral and energy resources...” Twitter post (11 October 2022), www.twitter.com/AfricanAmdc/status/1579789353584164864.
-
22
Based on S&P Global data and U.S. Geological Survey (2022). These sources sometimes differ significantly. An average is taken when the reported amounts are similar. When they are not, a third source is used to determine which is likely to be more accurate.
-
23
The correlation between exploration and mineral reserves per square kilometer is 0.79. The figure compares exploration for all metals except gold from 2002 to 2021 with current value of transition mineral reserves. Exploration spend, reserves and prices from S&P Global Market Intelligence; land area data from www.worldpopulationreview.com.
-
24
The correlation between the Resource Governance Index and Policy Potential Index scores is 0.5. The NRGI Resource Governance Index measures the transparency and accountability of mining institutions. The Policy Potential Index (PPI) in the Fraser Institute survey shows the attractiveness of a country’s policies to investors. The PPI score reported in the figure is an average of the scores from 2017 to 2021 where available, and average across jurisdictions for countries that have several. Some countries have low survey response rates, between 5 to 9 respondents. Natural Resource Governance Institute, “Resource Governance Index 2017,” 2017, resourcegovernanceindex.org; Yunis and Aliakbari (2021).
-
25
African Minerals Development Centre, Desktop Review of African Geological Survey Organisation Capacities and Gaps (United Nations Economic Commission for Africa, 2018), archive.uneca.org/publications/desktop-review-african-geological-survey-organisation-capacities-and-gaps.
-
26
Antony Sguazzin, “South Africa Sets 900 Million Annual Mineral Exploration Target,” Bloomberg, 12 April 2022, www.bloomberg.com/news/articles/2022-04-12/s-africa-sets-900-million-annual-mineral-exploration-target.
-
27
Oil exploration investment is known to correlated strongly with the quality of governance in a country, and it seems likely that a similar pattern holds for mineral exploration. See James Cust and Harding Torfinn, “Institutions and the Location of Oil Exploration”, Journal of the European Economic Association (2019).
-
28
Richard Schodde, “Key issues affecting the time delay between discovery and development – is it getting harder and longer?” PDAC 2014, 3 March 2014, Toronto. minexconsulting.com/wp-content/uploads/2019/04/Schodde-presentation-to-PDAC-March-2014.pdf
-
29
Summary of five studies. The outlier is the McKinsey study (7 to 10 years), but this was based on “large-scale greenfield assets” only. Like findings of Schodde (2021), which highlights that large projects are quicker. McKinsey (2022); IEA (2021); Tehmina Khan, Trang Nguyen, Franziska Ohnsorge, and Richard Schodde, “From Commodity Discovery to Production,” Policy Research Working Paper (World Bank, 2016); Paul Manalo, “Top mines average time from discovery to production: 16.9 years,” Metals and Mining Research S&P Global Market Intelligence (2020); Schodde (2014).
-
30
IEA (2021)
-
31
Schodde (2021) and Khan et al. (2016)
-
32
David Humphreys, “The mining industry and the supply of critical minerals,” Critical Minerals Handbook, Gus Gunn (ed.), chapter 2, 2013.
-
33
Khan et al. (2016)
-
34
Several of the experts interviewed for this report suggested that this is the main opportunity for shortening lead times.
-
35
David Manley, Patrick R.P. Heller and William Davis, No Time to Waste: Governing Cobalt Amid the Energy Transition (Natural Resource Governance Institute, 2022), resourcegovernance.org/no-time-to-waste-governing-cobalt-amid-energy-transition.
-
36
Matt Renaud and Mustafa Kumral, “Out of the Comfort Zone: Quantifying Country Risk for Foreign Mining Project Investment Feasibilities,” Mining, Metallurgy & Exploration, 38, 2323-2335 (2021), www.doi.org/10.1007/s42461-021-00495-8.
-
37
Based on S&P Global data and U.S. Geological Survey (2022). These sources sometimes differ significantly. An average is taken when the reported amounts are similar. When they are not, a third source is used to determine which is likely to be more accurate.
-
38
Henry Sanderson, “Vedanta starts arbitration against Zambia after mines seized,“ Financial Times, 31 May 2019. www.ft.com/content/98b0c464-83a1-11e9-b592-5fe435b57a3b.
-
39
Julia Tilley, “Labour talks 217: Escondida and other stories,” S&P Global Market Intelligence, Metals and Mining Research, 23 February 2017.
-
40
Keval Dhokia, “Global copper pipeline challenged due to disruption,” S&P Global Market Intelligence, Metals and Mining Research, 18 June 2019.
-
41
Sudarshan Varadhan, “Indian state seeks permanent closure of Vedanta’s copper smelter: officials,” Reuters, 24 May 2018. www.reuters.com/article/us-vedanta-smelter-idUSKCN1IP1CX.
-
42
Dhokia (2019)
-
43
Misha Savic, Jan Bratanic and Thomas Biesheuvel, “Europe’s Biggest Lithium Mine Blocked as Rio Loses in Serbia,” Bloomberg, 20 January 2022, www.bloomberg.com/news/articles/2022-01-20/serbia-suspends-rio-tinto-s-2-4-billion-lithium-mine-project.
-
44
Tanzania Minerals Audit Agency, A Study on Viability to Construct a Copper Concentrate Smelter in Tanzania (2011), www.scribd.com/document/193187016/A-Study-on-Viability-to-Construct-a-Copper-Concentrate-Smelter-in-Tanzania1.
-
45
Africa Confidential, “Local processing row holds up rare earth mine,” 25 October 2022, www.africa-confidential.com/article-preview/id/14166/Local_processing_row_holds_up_rare_earth_mine.
-
46
Reuters, “Timeline: The battle for Simandou,” 22 January 2021, www.reuters.com/article/us-swiss-steinmetz-timeline-idUSKBN29R2AA.
-
47
Magnus Ericsson and Olof Löf, “Mining’s contribution to national economies between 1996 and 2016,” Mineral Economics, 223–250 (2019), doi.org/10.1007/s13563-019-00191-6.
-
48
Net savings plus education expenditure and minus energy depletion, mineral depletion, net forest depletion, and carbon dioxide and particulate emissions damage. NRGI analysis of World Bank, “World Development Indicators,” accessed 28 September 2022, www.databank.worldbank.org/source/world-development-indicators.
-
49
Anthony J. Venables, “Using Natural Resources for Development: Why Has It Proven So Difficult?” Journal of Economic Perspectives, 30:1, 161–184 (2016) doi. org/10.1257/jep.30.1.161.
-
50
Giorgia Albertin, Boriana Yontcheva, Dan Devlin, Hilary Devine, Marc Gerard, Sebastian Beer, Irena Jankulov Suljagic and Vimal V. Thakoor, Tax Avoidance in Sub-Saharan Africa’s Mining Sector, Departmental Paper No 2021/022 (International Monetary Fund, 2021), www.imf.org/en/Publications/Departmental-Papers-Policy-Papers/Issues/2021/09/27/Tax-Avoidance-in-Sub-Saharan-Africas-Mining-Sector-464850
-
51
See for example, South African Human Rights Commission, National Hearing on the Underlying Socio-economic Challenges of Mining-affected Communities in South Africa (2016), www.sahrc.org.za/home/21/files/SAHRC%20Mining%20communities%20report%20FINAL.pdf
-
52
See, for example, Claude Kabemba, “How mineral resources can fuel the development of Africa in the context of post-Covid economic recovery,” Publish What You Pay Annual Conference, 14-15 March 2021, www.sarwatch.co.za/how-mineral-resources-can-fuel-the-development-of-africa-in-the-context-of-post-covid-economic-recovery.
-
53
See, for example, African Development Bank, Request for Expressions of Interest, 2022, www.afdb.org/sites/default/files/reoi_green_minerals_strategy_approach_paper_002.pdf.
-
54
Other partners currently include African Legal Support Facility, Africa Finance Corporation, Afreximbank, United Nations Economic Commission for Africa and United Nations Development Programme.
-
55
African Development Bank, “Why Africa is the next renewables powerhouse,” 7 December 2018, www.afdb.org/en/news-and-events/why-africa-is-the-next-renewables-powerhouse-18822
-
56
Manley et al (2022)
-
57
Through Power Africa (www.usaid.gov/powerafrica), for example.
-
58
Reserves data is from S&P Global Market Intelligence and U.S. Geological Survey. The above ground assets of a country comprise its power and transport infrastructure, human capital and other productive capabilities, level of environmental protection and investment climate. They have been converted to a regional index of 0-100.
The data is from multiple sources: African Development Bank, The Africa Infrastructure Development Index (AIDI) 2020, 2020, www.afdb.org/en/documents/economic-brief-africa-infrastructure-development-index-aidi-2020-july-2020; World Bank, “World Development Indicators”; African Development Bank, Electricity Regulatory Index (ERI) for Africa, 2021, 2021, africa-energy-portal.org/reports/electricity-regulatory-index-eri-africa-2021-edition; World Intellectual Property Organization, Global Innovation Index (GII) 2021, 2021, www.wipo.int/publications/en/details.jsp?id=4560; Harvard Growth Lab, “The Atlas of Economic Complexity,” accessed 20 September 2022, www.atlas.cid.harvard.edu/; Environmental Protection Index, “2022 Environmental Protection Index (2022),” accessed 20 September 2022, www.epi.yale.edu/; World Bank, “Doing Business 2020,” accessed 20 September 2022, www.worldbank.org/en/programs/business-enabling-environment/doing-business-legacy; S&P Global, “Control Risks Country Risk Summary,” accessed 20 September 2022, www.capitaliq.spglobal.com. -
59
Southern African Development Community and African Minerals Development Centre, Developing a Regional Mining Vision for the Southern African Development Community (SADC), 2018.
-
60
Manley et al (2022)
-
61
Emily Hersh, Alex Grant and Chris Berry, So, You Want to make Batteries Too? (Payne Institute, 2020), www.payneinstitute.mines.edu/so-you-want-to-make-batteries-better-too
-
62
Ibid.
-
63
See for example, African Development Bank, Lithium-Cobalt Value Chain Analysis for Mineral Based Industrialization in Africa (2021), www.afdb.org/en/documents/lithium-cobalt-value-chain-analysis-mineral-based-industrialization-Africa.
-
64
McKinsey & Company, Power to move: Accelerating the electric transport transition in sub-Saharan Africa (2022), www.mckinsey.com/industries/automotive-and-assembly/our-insights/power-to-move-accelerating-the-electric-transport-transition-in-sub- aharan-africa.
-
65
BloombergNEF, The Cost of Producing Battery Precursors in the DRC (2021), about. bnef.com/blog/producing-battery-materials-in-the-drc-could-lower-supply-chain-emissions-and-add-value-to-the-countrys-cobalt.
-
66
Mohua Mukherjee, India’s Mass-Market Clean Mobility Initiatives and its Unique, Customized Business Models for Light Electric Vehicles (The Oxford Institute for Energy Studies, 2022), www.oxfordenergy.org/publications/indias-mass-market-clean-mobility-initiatives-and-its-unique-customized-business-models-for-light-electric-vehicles.
-
67
Rwanda Ministry of Infrastructure, Strategic Paper on Electric Mobility Adaption in Rwanda (2021), www.mininfra.gov.rw/fileadmin/user_upload/Mininfra/Publications/Laws_Orders_and_Instructions/Transport/16062021_Strategic_Paper_for_e-mobility_adapta….
-
68
Manley et al (2022)
-
69
IEA (2022)
-
70
See for example World Gold Council, Responsible gold mining and value distribution, 2013 report (2013), www.gold.org/goldhub/research/responsible-gold-mining-and-value-distribution-2013-report.
-
71
World Gold Council (2013). Mining Shared Value has indicated these figures are representative of wider sector trends.
-
72
Jeff Geipel, Mining Shared Value, interview with authors, 25 September 2022.
-
73
Government of Canada, “Minerals Sector Employment,” January 2019, www.nrcan.gc.ca/science-data/science-research/earth-sciences/earth-sciences-resources/earth-sciences-federal-programs/minerals-sector-employment/16739; Mets Ignited, “METS in Australia,” accessed 28 September 2022, www.metsignited.org/australian-mets-sector/.
-
74
Aaron Cosbey and Isabelle Ramdoo, Guidance for Governments: Local Content Policies (Intergovernmental Forum on Mining, Minerals, Metals and Sustainable Development, 2018), igf-guidance-for-governments-local-content.pdf; International Finance Corporation, Guide to Getting Started in Local Procurement (2011), www.ifc.org/wps/wcm/connect/topics_ext_content/ifc_external_corporate_site/sustainability-at-ifc/publications/publications_handbook_guidetogettingsta…; Mining Shared Value and Engineers Without Borders, The Mining Local Procurement Reporting Mechanism (LPRM) (2017), www.miningsharedvalue.org/mininglprm.
-
75
See for example, activities of the Industrial Development Corporation (www.idc.co.za) and Anglo American’s Zimele programs (www.southafrica.angloamerican.com/our-difference/zimele)
-
76
Southern Africa Resource Watch, From Harmonisation of Policies to the Manufacturing of Lithium Batteries in Southern Africa: Collaboration between DRC and Zambia (2022), www.sarwatch.co.za/publication/from-harmonisation-of-policies-to-the-manufacturing-of-lithium-batteries-in-southern-africa-collaboration-between-drc-….
-
77
Jeff Geipel, Mining Shared Value, interview with authors, 25 September 2022.
-
78
Giorgia Albertin et al (2021). Note that the definition of mineral-dependent does not overlap with which countries have substantial reserves of transition minerals.
-
79
Ibid. The IMF estimates the 15 mineral-rich countries earned mining revenues equals 2 percent of GDP on average. This amounts to $13 billion a year.
-
80
For example, if companies were to adhere to more responsible tax practices such as the B Team Responsible Tax Principles. See The B Team, “Advancing Responsible Tax Practice,” accessed 28 September 2022, www.bteam.org/our-work/causes/governance/advancing-responsible-tax-practice.
-
81
Yannick Bouterige, Céline de Quatrebarbes and Bertrand Laporte, Mining Taxation in Africa: What Evolution in 2018? (International Centre for Tax and Development, 2020), www.ictd.ac/publication/mining-taxation-africa-recent-evolution.
-
82
Giorgia Albertin et al (2021).
-
83
For example, a study of contracts on resourcecontracts.org revealed that Burkina Faso, Burundi, Guinea, Madagascar and Mali had agreed stabilization clauses lasting 30- 34 years on average—significantly longer than necessary to ensure the bankability of projects. Intergovernmental Forum on Mining, Minerals, Metals and Sustainable Development, Insights on Incentives: Tax Competition in Mining (2019), www.iisd.org/sites/default/files/publications/insights-incentives-tax-competition-mining.pdf; Natural Resource Governance Institute, resourcecontracts.org.
-
84
NRGI analysis using S&P Global mineral reserves and price data. Prices are near-term forecasts and therefore may be elevated compared to the longer-term trend.
-
85
NRGI analysis. On average, 16 percent of mining sales revenue has gone to tax payments. See Robert Pitman and Kaisa Toroskainen, Beneath the surface: The Case for Oversight of Extractive Industry Suppliers (Natural Resource Governance Institute, 2020) resourcegovernance.org/analysis-tools/publications/beneath-surface-oversight-extractive-industry-suppliers.
This figure aligns with estimates in other studies: Olle Östensson, Local content, supply chains, and shared infrastructure, UNU-WIDER Working Paper (United Nations University, 2017), www.researchgate.net/publication/337699966_Local_content_supply_chains_and_shared_infrastructure; Price Waterhouse Coopers, Total Tax Contribution: A study of the economic contribution mining companies make to public finances (2010), www.pwc.co.uk/assets/pdf/ttc-mining-study-1.pdf. -
86
Anthony J. Venables (2016) and Natural Resource Governance Institute (2014).
-
87
NRGI (2017), “Resource Governance Index 2017.” There was a small improvement in a smaller sample of countries covered by the 2021 edition of the Resource Governance Institute.
-
88
Anna Fleming, Thomas Lassourd and David Manley, “Variable Royalties: an Answer to Volatile Mineral Prices?” in Handbook on the Future of Resource Taxation, African Tax Administration Forum and Intergovernmental Forum on Mining, Minerals, Metals and Sustainable Development (forthcoming),www.iisd.org/publications/brief/future-resource-taxation-roadmap.
-
89
Robert Pitman, “Contract Disclosure Policy and Practice Tracker,” accessed 15 October 2022, docs.google.com/spreadsheets/d/1FXEeD43jw6VYHV8yS-8KJ5-rR5l0XtKxVQZBWzr-ohY.
-
90
Based on membership of the Extractive Industries Transparency Initiative (www.eiti.org/countries).
-
91
Natural Resource Governance Institute, “Chile country profile,” accessed 5 October 2022, www.resourcegovernanceindex.org/country-profiles/CHL/mining.
-
92
Transparency International, “Corruption Perceptions Index 2021,” www.transparency.org/en/cpi/2021.
-
93
United Nations Office on Drugs and Crime, Corruption and Sustainable Development (no date), www.anticorruptionday.org/documents/actagainstcorruption/print/corr18_fs_DEVELOPMENT_en.pdf
-
94
K.C. Michaels, Louis Maréchal and Benjamin Katz, “Why is ESG so important to critical mineral supplies, and what can we do about it?” (International Energy Agency, 2022) www.iea.org/commentaries/why-is-esg-so-important-to-critical-mineral-supplies-and-what-can-we-do-about-it
-
95
Extractive Industries Transparency Initiative, Making the grade: Strengthening governance of critical minerals, www.eiti.org/documents/strengthening-governance-critical-minerals.
-
96
Extractive Industries Transparency Initiative, EITI Standard 2019, eiti.org/collections/ eiti-standard#EITI-Requirements-2019; Organisation for Economic Co-operation and Development, OECD Due Diligence Guidance for Responsible Supply Chains of Minerals from Conflict-Affected and High-Risk Areas (2016), www.oecd.org/daf/inv/mne/OECD-Due-Diligence-Guidance-Minerals-Edition3.pdf; Alexandra Gillies, Sebastian Sahla, Matthieu Salomon and Tom Shipley, Diagnosing Corruption in the Extractive Sector: A Tool for Research and Action (Natural Resource Governance Institute, 2021) www.resourcegovernance.org/analysis-tools/publications/diagnosing-corruption-extractive-sector-tool-research-and-actionrespectively.
-
97
Colombia National Mining Agency, Management and Corruption Risk Matrices of the ANM approved by the Institutional Management
and Performance Committee on 01/27/2022 (2022), www.anm.gov.co/?q=documentos_para_comentarios_ciudadania; Robert Pitman and Kaisa Toroskainen, “BHP, Others Increase Scrutiny of Subcontracting Corruption Risks” (Natural Resource Governance Institute, 2018) www.resourcegovernance.org/blog/bhp-others-increase-scrutiny-subcontracting-corruption-risks. -
98
Alexandra Gillies, “Will Extractive Companies Move Away from Corruption- Prone Intermediaries?”, (Natural Resource Governance Institute, 2019) www.resourcegovernance.org/blog/extractive-companies-corruption-intermediaries-middlemen-oil.
-
99
Natural Resource Governance Institute, Anticorruption Guidance for Partners of State-Owned Enterprises (2022), soe-anticorruption.resourcegovernance.org/chapters/avoiding-high-risk-agents
-
100
Favour Ime and Louise Russell-Prywata, “Beneficial ownership transparency and the fight against grand corruption in Nigeria” (Open Ownership, 2022), www.openownership.org/en/blog/beneficial-ownership-transparency-and-the-fight-against-grand-corruption-in-nigeria.
-
101
Nqobile Dludla, “South Africa mine dam wall collapses, Killing 1 and injuring 40,” Reuters, 11 September 2022, www.reuters.com/world/africa/south-africa-mine-dam-wall-collapses-killing-three-injuring-40-2022-09-11.
-
102
Kirsten Hund and Erik Reed, “A low-carbon future must protect the world’s forests” (World Bank, 2019), www.blogs.worldbank.org/voices/low-carbon-future-must-protect-worlds-forests.
-
103
NRGIcalculationsusingscope1,2and3 emissions (excluding fugitive methane and emissions from the combustion of coal) reported by Lindsay Delevingne, Will Glazener, Liesbet Grégoir and Kimberly Henderson, “Climate risk and decarbonisation: What every mining CEO needs to know,” McKinsey & Company, 2020 www.mckinsey.com/business-functions/sustainability/our-insights/climate-risk-and-decarbonization-what-every-mining-ceo-needs-to-know. Total global emissions are for 2019 from Climate Watch, “Global Historical Emissions,” accessed 18 September 2022, www.climatewatchdata.org/ghg-emissions?end_year=2019&start_year=1990.
-
104
See for example, Éléonore Lèbre, Martin Stringer, Kamila Svobodova, John R. Owen, Deanna Kemp, Claire Côte, Andrea Arratia-Solar and Rick K. Valenta, “The social and environmental complexities of extracting energy transition metals,” Nature Communications, 11: 4823 (2020), www.nature.com/articles/s41467-020-18661-9#MOESM1.
-
105
IEA (2021)
-
106
Ibid.
-
107
World Bank, “Climate Change Knowledge Portal,” accessed 28 September 2022, www.climateknowledgeportal.worldbank.org.
-
108
NRGI (2017)
-
109
Cameroon is one exception, with its new cadastre system preventing licenses being granted that overlap protected areas. Several companies also have a no-go policy, though only for World Heritage sites. See for example ICMM, “ICMM calls for stronger legal protection of World Heritage Sites,” 2016, www.icmm.com/en-gb/news/2016/icmm-calls-for-protection-of-world-heritage-sites.
-
110
Abbi Buxton, People and nature first: safeguards needed in mining exploration (International Institute for Environment and Development, 2021) www.iied.org/20736iied.
-
111
See for example in Colombia: Lorenzo Cotula, Investment disputes from below: whose rights matter? (International Institute for Environment and Development, 2020), www.iied.org/investment-disputes-below-whose-rights-matter.
-
112
Nicola Woodroffe and Tim Grice, Beyond Revenues: Measuring and Valuing Environmental and Social Impacts in Extractive Sector Governance (Natural Resource Governance Institute, 2019), www.resourcegovernance.org/analysis-tools/publications/beyond-revenues-measuring-environmental-social-impacts.
-
113
IFC, E&S Performance Standards (2012), www.ifc.org/wps/wcm/connect/topics_ext_content/ifc_external_corporate_site/sustainability-at-ifc/policies-standards/performance-standards; IGF, Environmental and Social Impact Assessments (2020), www.igfmining.org/our-work/environmental-and-social-impact-assessments.
-
114
Daniel Whyte, “Forest finance: how Gabon earned the first payment for conservation in Africa,” Climate Tracker, 8 December 2021, www.climatetracker.org/forest-protection-first-payment-gabon-africa.
-
115
See for example Taako Edema George, Kiemo Karatu, and Andama Edward, “An evaluation of the environmental impact assessment practice in Uganda: challenges and opportunities for achieving sustainable development,” Heliyon 6(9), 2020, www.ncbi.nlm.nih.gov/pmc/articles/PMC7505666.
-
116
See for example Organisation for Economic Co-operation and Development, Guiding Principles for Durable Extractive Contracts (2019), www.oecd.org/dev/Guiding_Principles_for_durable_ extractive_contracts.pdf; United Nations Human Rights Office
of the High Commissioner, Principles for Responsible Contracts: Integrating the Management of Human Rights Risks into State-Investor Contract Negotiations- Guidance for Negotiators (2015), www.ohchr.org/%20Documents/Publications/Principles_ResponsibleContracts_HR_PUB_15_1_EN.pdf; and NRGI (2014). -
117
See for example Reuters, “South Africa’s Gold Fields bets on solar to cut costs and carbon,” 13 October 2022, www.reuters.com/business/sustainable-business/south-africas-gold-fields-bets-solar-cut-costs-carbon-2022-10-13.
-
118
U.N. Climate Change Conference UK 2021, “Glasgow Leaders’ Declaration on Forests and Land Use,” 2021, ukcop26.org/glasgow-leaders-declaration-on-forests-and-land-use.
-
119
Frances Seymour, Tony La Vina and Kristen Hite, Evidence linking community-level tenure and forest condition: An annotated bibliography (Climate and Land Use Alliance, 2015), www.climateandlandusealliance.org/wp-content/uploads/2015/08/Community_level_tenure_and_forest_condition_bibliography.pdf.
-
120
Peter G. Veit, “9 Facts about Community Land and Climate Mitigation” (World Resources Institute, 2021) files.wri.org/d8/s3fs-public/2021-10/9-facts-about-community-land-and-climate-mitigation.pdf.
-
121
Development Bank of Southern Africa, African Environmental Assessment Legislation Handbook: Consultation Draft, 2021, www.dbsa.org/african-environmental-assessment-legislation-handbook.
-
122
United Nations Development Programme, Participatory Environmental Monitoring Committees in Mining Contexts, 2019, www.undp.org/publications/participatory-environmental-monitoring-committees-mining-contexts.
-
123
Jonathan Watts, “Murders of environment and land defenders hit record high,” The Guardian, 13 September 2021, www.theguardian.com/environment/2021/sep/13/murders-environment-land-defenders-record-high.
-
124
NRGI (2017), “Resource Governance Index 2017.” There was a small improvement in a smaller sample of countries covered by the 2021 edition of the Resource Governance Institute.
-
125
With a gold price of USD 1,600 per ounce.
-
126
With a low-profit mine and a gold price of $1,600 per ounce.
-
127
Cecilia Jamasmie, “Petra Diamonds’ stake in Williamson to shrink as part of deal with Tanzania,” Mining.com, 13 December 2021, www.mining.com/petra-diamonds-stake-in-williamson-to-shrink-as-part-of-deal-with-tanzania.
-
128
Lifezone Metals, “Kabanga Nickel Signs Framework Agreement,” 19 January 2021, www.lifezonemetals.com/kabanga-nickel-signs-framework-agreement.
-
129
Thomas Scurfield and Silas Olan’g, “Magufuli Seeks the Right Balance for Tanzania’s Mining Fiscal Regime,” NRGI, 31 January 2019, www.resourcegovernance.org/blog/magufuli-seeks-right-balance-tanzania-mining-fiscal; Thomas Scurfield, “Tanzania Strikes a Better Balance with its Mining Fiscal Regime,” NRGI, 24 June 2020, www.resourcegovernance.org/blog/tanzania-strikes-better-balance-mining-fiscal-regime.
-
130
This framework agreement was published in a document setting out Barrick’s offer to buy the shares it did not already own in Acacia Mining, the previous owner of the Bulyanhulu, Buzwagi and North Mara mines in Tanzania. See Acacia Mining and Barrick Gold, Recommended Final Offer for Acacia Mining Plc by Barrick Gold Corporation, 2019, 66–79, s25.q4cdn.com/322814910/files/doc_downloads/acacia/Acacia-2.7-announcement.pdf.
-
131
The main revenue streams are import duty, skills development levy, royalty, corporate income tax, a share of dividends and shareholder loan repayments through state equity, and dividend withholding tax.
-
132
The earlier in time a shilling (Tanzania’s official currency unit) is received, the more it is worth. This is, first, because it can be used earlier; and second, because the future is uncertain, and no one can be sure they will receive that shilling in the future. To account for this time value of money, a “discount rate” is applied. In the sharing arrangement, this would mean that if the government received a shilling in year 1, the company would need to receive more than a shilling in year 2 for the benefits to be comparable. However, given cumulation here is based on actual cash flow, the company would need to receive only a shilling in year 2 for the benefits to be shared equally.
-
133
This provision for the company to earn its minimum return before sharing is triggered means Ecuador’s mechanism is similar to an R-based cash flow tax, commonly referred to as a Brown Tax. See, e.g., Robin Broadway and Michael Keen, “Theoretical perspectives on resource tax design,” in The Taxation of Petroleum and Minerals: Principles, Problems and Practice, edited by Philip Daniel, Michael Keen and Charles McPherson (Oxford: Routledge, 2010), 13–74.
-
134
Prices are taken from World Bank, “Commodities Price Data (The Pink Sheet),” www.worldbank.org/en/research/commodity-markets.
-
135
With a gold price of $1,600 per ounce.
-
136
With a gold price of $1,600 per ounce.
-
137
With a gold price of $1,600 per ounce.
-
138
The Fraser Institute survey estimates that, unless there are extremely harmful policies, around 60 percent of an investment decision tends to be based on a country’s geology. The other 40 percent comprises of several other factors, including political stability and policy predictability (given they affect the risk that investors will not be able to secure future returns generated by their investments), a conducive business environment and the tax level. See Julio Mejia and Elmira Aliakbari, Fraser Institute Annual Survey of Mining Companies 2022, (Fraser Institute, 2023), 8, www.fraserinstitute.org/studies/annual-survey-of-mining-companies-2022.
-
139
However, information gaps make it difficult for taxes to be structured to capture all excess profit. See Jean-Franҫois Wen, Progressive Taxation of Extractive Resources as Second-Best Optimal Policy (International Monetary Fund, 2018), www.imf.org/en/Publications/WP/Issues/2018/06/13/Progressive-Taxation-of-Extractive-Resources-as-Second-Best-Optimal-Policy-45923.
-
140
Recent research provides a sense of the potential revenue loss to governments from tax avoidance. The International Monetary Fund recently estimated that sub-Saharan African mining countries could be losing between $450 and $730 million in corporate income tax a year. See Sebastian Beer and Dan Devlin, Is There Money on the Table? Evidence on the Magnitude of Profit Shifting in the Extractive Industries (International Monetary Fund, 2021), www.imf.org/en/Publications/WP/Issues/2021/01/15/Is-There-Money-on-the-Table-Evidence-on-the-Magnitude-of-Profit-Shifting-in-the-Extractive-49983.
-
141
It is perhaps surprising that Tanzania’s 50-50 sharing arrangement generates an AETR greater than 50 percent (with a discount rate of 10 percent). This is despite AETR measuring government take as the share of pre-tax profits, which is larger than “economic benefits” (given economic benefits exclude interest payments). This outcome results from the 50-50 split being based on actual cash flow. The government receives revenue before the mining company through input and production taxes that do not depend on the mine making a profit. Because of these earlier revenues, the government receives a larger share on a discounted basis.
-
142
As reported in the S&P Global database. Legal risks are “expropriation, state contract alteration and contract enforcement risks.” Tax risks are “tax increase and tax inconsistency risks.” Control Risks scores these risks as still “very high” and “high” respectively (following Tanzania’s overhaul of extractives sector laws and other actions against existing mines in 2017) but reducing.
-
143
With a discount rate of 10 percent. While Ecuador’s sharing mechanism does not account for the labor profit share because none of it will go to the government from 2024 onwards, I have included it in the AETR because it is a tax on the project. The Democratic Republic of Congo regime has an excess profits tax that is triggered for a mine when the realized price is at least 25 percent higher than the price in its feasibility study. I assumed that the feasibility study has a price of $1,300 per ounce, so the excess profits tax is not triggered.
-
144
Total benefits in this case are a project’s revenues minus operating costs and replacement capital (but not minus exploration and development capital). This cash flow represents the money available to pay back the initial investment and provide a return. The government share of it is a common measure of progressivity.
-
145
Wen, Progressive Taxation of Extractive Resources as Second-Best Optimal Policy.
-
146
With a discount rate of 10 percent. The results for only some countries are shown to clearly depict each data point. The results for all the evaluated countries can be found in my model.
-
147
Scurfield, “Tanzania Strikes a Better Balance with its Mining Fiscal Regime.”
-
148
This feature is not fully reflected in Figure 5 given that “total benefits” use a slightly different definition of profits and are based on discounted cash flows.
-
149
With a gold price of $1,600 per ounce.
-
150
For example, an average 62 percent of respondents to the Fraser Institute surveys between 2017 and 2019 said the current implementation of Tanzania’s legal system would strongly discourage investment, and 73 percent said regulatory uncertainty would. See, e.g., Ashley Stedman, Jairo Yunis and Elmira Aliakbari, Fraser Institute Annual Survey of Mining Companies 2019 (Fraser Institute, 2020), www.fraserinstitute.org/studies/annual-survey-of-mining-companies-2019.
-
151
With a low-profit mine and a gold price of $1,600 per ounce.
-
152
Tax avoidance could extend the Philippines’ recovery period, and therefore delay the payment of some taxes including import duty and interest withholding tax, given the end of the recovery period depends on the reported profitability of a mine rather than an ex-ante assessment. However, the rule that the recovery period must end five years from the start of production regardless of whether pre-production expenses have been recouped limits the extent to which it can be extended.
-
153
The merits of these measures require further scrutiny. E.g., taking a share of loan repayments could result in lenders charging a higher interest rate to ensure they still recoup their loan and a minimum return. This would not only reduce taxable income but also make it harder for the government to assess whether an interest rate is reasonable, because it would not be comparable with industry benchmarks. It can also be difficult for a government to always determine whether a loan is from a related party or not. However, these considerations are outside the scope of this analysis.
-
154
Natural Resource Governance Institute (NRGI), Natural Resource Charter, 2nd edition, 2014, resourcegovernance.org/analysis-tools/publications/natural-resource-charter-2nd-ed.
-
155
Although its exclusion of several significant taxes from the government’s share of benefits means low-profit mines may still be impacted.
-
156
With a gold price of $1,600 per ounce.
-
157
Anna Fleming, Thomas Lassourd and David Manley, “Variable Royalties: an Answer to Volatile Mineral Prices?” in Handbook on the Future of Resource Taxation, African Tax Administration Forum and Intergovernmental Forum on Mining, Minerals, Metals and Sustainable Development (forthcoming), www.iisd.org/publications/brief/future-resource-taxation-roadmap.
-
158
Ensuring that interest rates used as a comparison apply to comparable assets with a similar risk profile is challenging, but rules of this nature have been successful in reducing profit shifting in other countries. See Beer and Devlin, Is There Money on the Table?.
-
159
The main taxes listed are VAT, royalty and corporate income tax. The regime also includes a share of pre-tax profits that is currently divided between the company’s workers and the government, with the portion received by the government included in its accumulated benefits. However, a recent court ruling means that all this labor profit share will go to workers from the start of 2024 and therefore none of it will be included in government benefits.
-
160
The discount rate used is specific to each mine and based on its weighted average cost of capital (WACC). I have assumed that WACC is around 7 percent in real terms. This is based on the typical discount rate for equity shareholders used by industry and government analysts of 8 percent in real terms, and the current average cost of debt for the mining sector as reported by Aswath Damodaran, Damodaran Online, www.pages.stern.nyu.edu/~adamodar.
-
161
Republic of the Philippines, Financial or Technical Assistance Agreement, mgb.gov.ph/attachments/article/79/PFC_FTAA.pdf.
-
162
For example, some terms in the original FTAA for an OceanaGold mine differed in some areas: Republic of the Philippines, Financial or Technical Assistance Agreement with Arimco Mining Corporation, 1994, www.resourcecontracts.org/contract/ocds-591adf-2792396017. I understand that the recently signed extension to this agreement has slightly different terms again.
-
163
A template of the FARI model and a user guide that explains all the concepts and workings of the model are available at International Monetary Fund, “Fiscal Analysis of Resource Industries,”www.imf.org/external/np/fad/fari.
Evolution of Mining Industry Taxation Toward a Bold New Future for African Mining (Mining Indaba)
Insiders Stage, Cape Town International Conference Centre
This AMLA platform is a tool that African governments and legislative drafters may utilise in developing legislation, or which may serve as an educational device for parliamentarians, mining sector regulatory bodies, and civil society to better understand some of the possible legal solutions or systems for regulating the mining sector. The AMLA Guiding Template represents an enhanced starting point for its users by providing a clear and practical foundation on which they can thoroughly consider topical issues supported by sample drafting language as they develop, modify, or simply assess mining legislative frameworks that fit each country's unique context. The various toolkits developed to complement the AMLA platform and the Guiding Template provide enhanced analyses, references, and practical guidance on addressing specific mining legal issues.
This session will include a presentation of AMLA’s activities over the years, a presentation on previous toolkits and introduction of the Mineral Taxation Toolkit, and an expert panel session, featuing NRGI's Thomas Scurfield, addressing:
• impacts of mining fiscal policy approaches in Africa
• tax avoidance and the OECD BEPS initiative
• incentives regimes
• tax administration
• proposals for reform to maximize benefits
Featuring NRGI's

Thomas Scurfield
Africa Senior Economic Analyst
Notes
-
1
International Energy Agency, The Role of Critical Minerals in Clean Energy Transitions (2021), www.iea.org/reports/the-role-of-critical-minerals-in-clean-energy-transitions.
-
2
In this report we refer to both Africa north and south of the Sahara. When we mean one of the sub-regions we specify as such.
-
3
IEA (2021); Clyde Russell, “Mining is key to energy transition, but it’s still unloved,” Reuters, 11 May 2022, www.reuters.com/business/energy/mining-is-key-energy-transition-its-still-unloved-russell-2022-05-11; Jairo Yunis and Elmira Aliakbari, Annual Survey of Mining Companies 2020 (Fraser Institute, 2021), www.fraserinstitute. org/studies/annual-survey-of-mining-companies-2020.
-
4
See, for example, Natural Resource Governance Institute, Natural Resource Charter 2nd edition (2014), resourcegovernance.org/approach/natural-resource-charter.
-
5
Natural Resource Governance Institute, Resource Governance Index: From Legal Reform to Implementation in Sub-Saharan Africa (2018), resourcegovernance.org/sites/default/files/documents/rgi-from-legal-reform-to-implementation-sub-saharan-africa.pdf.
-
6
Africa Climate Foundation, Geopolitics of Critical Minerals in Renewable Energy Supply Chains (2022), africanclimatefoundation.org/news_and_analysis/geopolitics-of-critical-minerals-in-renewable-energy-supply-chains/.
-
7
See for example, Cooper Inveen, “Atlantic Lithium’s Ghana mine poised to being production by 2024,” Reuters, 20 September 2022, www.reuters.com/article/ghana-mining-lithium/atlantic-lithiums-ghana-mine-poised-to-begin-production-by-2024-idUSKBN2QV0NQ?utm_source=substack&utm_me….
-
8
As demonstrated by recent discussions between a U.S.-led group of rich countries and mineral producers such as the Democratic Republic of Congo, Namibia and Tanzania. Julian Pecquet, “US looks to Africa to
diversify supply chain for critical minerals,” The Africa Report, 23 September 2022. www.theafricareport.com/243847/us-looks-to-africa-to-diversify-supply-chain-for-critical-minerals. -
9
Glada Llahn and Paul Stevens, The curse of the one-size-fits-all fix, UNU-WIDER Working Paper (United Nations University, 2017), www.wider.unu.edu/sites/default/files/wp2017-21.pdf. For further assessment of donors’ activities in the past, both positive and negative lessons, see: Joanna Buckley, Neil McCulloch and Nick Travis, Donor-supported approaches to improving extractives governance, UNU-WIDER Working Paper (United Nations University, 2017), www.wider.unu.edu/sites/default/files/wp2017-33.pdf; Siân Herbert and Laura Bolton, Donor activity in the extractives sector (Knowledge, evidence and learning for development, 2018), opendocs.ids.ac.uk/opendocs/bitstream/handle/20.500.12413/13589/Donor_activity_in_the_extractives_sector.pdf.
-
10
Although this estimate includes emissions resulting from the investments by each group. Lucas Chancel, “Global carbon inequality over 1990–2019,” Nature Sustainability (2022), doi. org/10.1038/s41893-022-00955-z.
-
11
For Further reading on this dilemma and the arguments between the proponents of “green growth” and “degrowth, see: Alex Bowen and Samuel Fankhauser, “The Green Growth Narrative: Paradigm Shift or Just Spin? Global Environmental Change-human and Policy Dimensions,” Global Environmental Change, 21 (2021), 1157-1159, DOI: I:10.1016/j. gloenvcha.2011.07.007; Kate Raworth, Doughnut Economics: Seven Ways to Think Like a 21st Century Economist, Random House Business Books, London, 2017; Jason Hickel, “What does degrowth mean? A few points of clarification,” Globalizations, 18:7 (2021), 1105-1111, DOI: 10.1080/14747731.2020.1812222.
-
12
McKinsey & Company, “The raw-materials challenges: How the metals and mining sector will be at the core of enabling the energy transition” (2022), www.mckinsey. com/industries/metals-and-mining/our-insights/the-raw-materials-challenge-how-the-metals-and-mining-sector-will-be-at-the-core-of-enabling-the-energy-transition.
-
13
McKinsey & Company, “Metal mining constraints on the electric mobility horizon” (2018), www.mckinsey.com/industries/oil-and-gas/our-insights/metal-mining-constraints-on-the-electric-mobility-horizon.
-
14
McKinsey (2018)
-
15
NRGI analysis, based on Net Zero Tracker. “Net Zero Tracker,” Energy and Climate Intelligence Unit, Data-Driven EnviroLab, NewClimate Institute, Oxford Net Zero (2022), zerotracker.net
-
16
Pratima Desai, “Low carbon world needs $1.7 trillion in mining investment,” Reuters, 10 May 2021, www.reuters.com/business/energy/low-carbon-world-needs-17-trillion-mining-investment-2021-05-10/
-
17
Based on S&P Global Market Intelligence data and U.S. Geological Survey, Mineral Commodity Summaries 2022, 2022, www.pubs.er.usgs.gov/publication/mcs2022. These sources sometimes differ significantly. An average is taken when the reported amounts are similar. When they are not, a third source is used to determine which is likely to be more accurate.
-
18
NRGI analysis based on reserves reported in the S&P Globaldatabase and U.S. Geological Survey (2022), and the mineral volumes in a standard electric vehicle in IEA (2021).
-
19
See for example, World Bank, “New World Bank Survey Brings Hope to Malawi’s Mineral Potential,” 22 September 2015, www.worldbank.org/en/news/feature/2015/09/22/new-world-bank-survey-brings-hope-to-malawis-mineral-potential.
-
20
International Energy Agency, Global Supply Chains of EV Batteries (2022), www.iea.org/reports/global-supply-chains-of-ev-batteries.
-
21
African Minerals Development Centre (AMDC), “Unveiled: The #AMDC’s Theory of Change: A prosperous and transformed Africa achieved through sustainable development of mineral and energy resources...” Twitter post (11 October 2022), www.twitter.com/AfricanAmdc/status/1579789353584164864.
-
22
Based on S&P Global data and U.S. Geological Survey (2022). These sources sometimes differ significantly. An average is taken when the reported amounts are similar. When they are not, a third source is used to determine which is likely to be more accurate.
-
23
The correlation between exploration and mineral reserves per square kilometer is 0.79. The figure compares exploration for all metals except gold from 2002 to 2021 with current value of transition mineral reserves. Exploration spend, reserves and prices from S&P Global Market Intelligence; land area data from www.worldpopulationreview.com.
-
24
The correlation between the Resource Governance Index and Policy Potential Index scores is 0.5. The NRGI Resource Governance Index measures the transparency and accountability of mining institutions. The Policy Potential Index (PPI) in the Fraser Institute survey shows the attractiveness of a country’s policies to investors. The PPI score reported in the figure is an average of the scores from 2017 to 2021 where available, and average across jurisdictions for countries that have several. Some countries have low survey response rates, between 5 to 9 respondents. Natural Resource Governance Institute, “Resource Governance Index 2017,” 2017, resourcegovernanceindex.org; Yunis and Aliakbari (2021).
-
25
African Minerals Development Centre, Desktop Review of African Geological Survey Organisation Capacities and Gaps (United Nations Economic Commission for Africa, 2018), archive.uneca.org/publications/desktop-review-african-geological-survey-organisation-capacities-and-gaps.
-
26
Antony Sguazzin, “South Africa Sets 900 Million Annual Mineral Exploration Target,” Bloomberg, 12 April 2022, www.bloomberg.com/news/articles/2022-04-12/s-africa-sets-900-million-annual-mineral-exploration-target.
-
27
Oil exploration investment is known to correlated strongly with the quality of governance in a country, and it seems likely that a similar pattern holds for mineral exploration. See James Cust and Harding Torfinn, “Institutions and the Location of Oil Exploration”, Journal of the European Economic Association (2019).
-
28
Richard Schodde, “Key issues affecting the time delay between discovery and development – is it getting harder and longer?” PDAC 2014, 3 March 2014, Toronto. minexconsulting.com/wp-content/uploads/2019/04/Schodde-presentation-to-PDAC-March-2014.pdf
-
29
Summary of five studies. The outlier is the McKinsey study (7 to 10 years), but this was based on “large-scale greenfield assets” only. Like findings of Schodde (2021), which highlights that large projects are quicker. McKinsey (2022); IEA (2021); Tehmina Khan, Trang Nguyen, Franziska Ohnsorge, and Richard Schodde, “From Commodity Discovery to Production,” Policy Research Working Paper (World Bank, 2016); Paul Manalo, “Top mines average time from discovery to production: 16.9 years,” Metals and Mining Research S&P Global Market Intelligence (2020); Schodde (2014).
-
30
IEA (2021)
-
31
Schodde (2021) and Khan et al. (2016)
-
32
David Humphreys, “The mining industry and the supply of critical minerals,” Critical Minerals Handbook, Gus Gunn (ed.), chapter 2, 2013.
-
33
Khan et al. (2016)
-
34
Several of the experts interviewed for this report suggested that this is the main opportunity for shortening lead times.
-
35
David Manley, Patrick R.P. Heller and William Davis, No Time to Waste: Governing Cobalt Amid the Energy Transition (Natural Resource Governance Institute, 2022), resourcegovernance.org/no-time-to-waste-governing-cobalt-amid-energy-transition.
-
36
Matt Renaud and Mustafa Kumral, “Out of the Comfort Zone: Quantifying Country Risk for Foreign Mining Project Investment Feasibilities,” Mining, Metallurgy & Exploration, 38, 2323-2335 (2021), www.doi.org/10.1007/s42461-021-00495-8.
-
37
Based on S&P Global data and U.S. Geological Survey (2022). These sources sometimes differ significantly. An average is taken when the reported amounts are similar. When they are not, a third source is used to determine which is likely to be more accurate.
-
38
Henry Sanderson, “Vedanta starts arbitration against Zambia after mines seized,“ Financial Times, 31 May 2019. www.ft.com/content/98b0c464-83a1-11e9-b592-5fe435b57a3b.
-
39
Julia Tilley, “Labour talks 217: Escondida and other stories,” S&P Global Market Intelligence, Metals and Mining Research, 23 February 2017.
-
40
Keval Dhokia, “Global copper pipeline challenged due to disruption,” S&P Global Market Intelligence, Metals and Mining Research, 18 June 2019.
-
41
Sudarshan Varadhan, “Indian state seeks permanent closure of Vedanta’s copper smelter: officials,” Reuters, 24 May 2018. www.reuters.com/article/us-vedanta-smelter-idUSKCN1IP1CX.
-
42
Dhokia (2019)
-
43
Misha Savic, Jan Bratanic and Thomas Biesheuvel, “Europe’s Biggest Lithium Mine Blocked as Rio Loses in Serbia,” Bloomberg, 20 January 2022, www.bloomberg.com/news/articles/2022-01-20/serbia-suspends-rio-tinto-s-2-4-billion-lithium-mine-project.
-
44
Tanzania Minerals Audit Agency, A Study on Viability to Construct a Copper Concentrate Smelter in Tanzania (2011), www.scribd.com/document/193187016/A-Study-on-Viability-to-Construct-a-Copper-Concentrate-Smelter-in-Tanzania1.
-
45
Africa Confidential, “Local processing row holds up rare earth mine,” 25 October 2022, www.africa-confidential.com/article-preview/id/14166/Local_processing_row_holds_up_rare_earth_mine.
-
46
Reuters, “Timeline: The battle for Simandou,” 22 January 2021, www.reuters.com/article/us-swiss-steinmetz-timeline-idUSKBN29R2AA.
-
47
Magnus Ericsson and Olof Löf, “Mining’s contribution to national economies between 1996 and 2016,” Mineral Economics, 223–250 (2019), doi.org/10.1007/s13563-019-00191-6.
-
48
Net savings plus education expenditure and minus energy depletion, mineral depletion, net forest depletion, and carbon dioxide and particulate emissions damage. NRGI analysis of World Bank, “World Development Indicators,” accessed 28 September 2022, www.databank.worldbank.org/source/world-development-indicators.
-
49
Anthony J. Venables, “Using Natural Resources for Development: Why Has It Proven So Difficult?” Journal of Economic Perspectives, 30:1, 161–184 (2016) doi. org/10.1257/jep.30.1.161.
-
50
Giorgia Albertin, Boriana Yontcheva, Dan Devlin, Hilary Devine, Marc Gerard, Sebastian Beer, Irena Jankulov Suljagic and Vimal V. Thakoor, Tax Avoidance in Sub-Saharan Africa’s Mining Sector, Departmental Paper No 2021/022 (International Monetary Fund, 2021), www.imf.org/en/Publications/Departmental-Papers-Policy-Papers/Issues/2021/09/27/Tax-Avoidance-in-Sub-Saharan-Africas-Mining-Sector-464850
-
51
See for example, South African Human Rights Commission, National Hearing on the Underlying Socio-economic Challenges of Mining-affected Communities in South Africa (2016), www.sahrc.org.za/home/21/files/SAHRC%20Mining%20communities%20report%20FINAL.pdf
-
52
See, for example, Claude Kabemba, “How mineral resources can fuel the development of Africa in the context of post-Covid economic recovery,” Publish What You Pay Annual Conference, 14-15 March 2021, www.sarwatch.co.za/how-mineral-resources-can-fuel-the-development-of-africa-in-the-context-of-post-covid-economic-recovery.
-
53
See, for example, African Development Bank, Request for Expressions of Interest, 2022, www.afdb.org/sites/default/files/reoi_green_minerals_strategy_approach_paper_002.pdf.
-
54
Other partners currently include African Legal Support Facility, Africa Finance Corporation, Afreximbank, United Nations Economic Commission for Africa and United Nations Development Programme.
-
55
African Development Bank, “Why Africa is the next renewables powerhouse,” 7 December 2018, www.afdb.org/en/news-and-events/why-africa-is-the-next-renewables-powerhouse-18822
-
56
Manley et al (2022)
-
57
Through Power Africa (www.usaid.gov/powerafrica), for example.
-
58
Reserves data is from S&P Global Market Intelligence and U.S. Geological Survey. The above ground assets of a country comprise its power and transport infrastructure, human capital and other productive capabilities, level of environmental protection and investment climate. They have been converted to a regional index of 0-100.
The data is from multiple sources: African Development Bank, The Africa Infrastructure Development Index (AIDI) 2020, 2020, www.afdb.org/en/documents/economic-brief-africa-infrastructure-development-index-aidi-2020-july-2020; World Bank, “World Development Indicators”; African Development Bank, Electricity Regulatory Index (ERI) for Africa, 2021, 2021, africa-energy-portal.org/reports/electricity-regulatory-index-eri-africa-2021-edition; World Intellectual Property Organization, Global Innovation Index (GII) 2021, 2021, www.wipo.int/publications/en/details.jsp?id=4560; Harvard Growth Lab, “The Atlas of Economic Complexity,” accessed 20 September 2022, www.atlas.cid.harvard.edu/; Environmental Protection Index, “2022 Environmental Protection Index (2022),” accessed 20 September 2022, www.epi.yale.edu/; World Bank, “Doing Business 2020,” accessed 20 September 2022, www.worldbank.org/en/programs/business-enabling-environment/doing-business-legacy; S&P Global, “Control Risks Country Risk Summary,” accessed 20 September 2022, www.capitaliq.spglobal.com. -
59
Southern African Development Community and African Minerals Development Centre, Developing a Regional Mining Vision for the Southern African Development Community (SADC), 2018.
-
60
Manley et al (2022)
-
61
Emily Hersh, Alex Grant and Chris Berry, So, You Want to make Batteries Too? (Payne Institute, 2020), www.payneinstitute.mines.edu/so-you-want-to-make-batteries-better-too
-
62
Ibid.
-
63
See for example, African Development Bank, Lithium-Cobalt Value Chain Analysis for Mineral Based Industrialization in Africa (2021), www.afdb.org/en/documents/lithium-cobalt-value-chain-analysis-mineral-based-industrialization-Africa.
-
64
McKinsey & Company, Power to move: Accelerating the electric transport transition in sub-Saharan Africa (2022), www.mckinsey.com/industries/automotive-and-assembly/our-insights/power-to-move-accelerating-the-electric-transport-transition-in-sub- aharan-africa.
-
65
BloombergNEF, The Cost of Producing Battery Precursors in the DRC (2021), about. bnef.com/blog/producing-battery-materials-in-the-drc-could-lower-supply-chain-emissions-and-add-value-to-the-countrys-cobalt.
-
66
Mohua Mukherjee, India’s Mass-Market Clean Mobility Initiatives and its Unique, Customized Business Models for Light Electric Vehicles (The Oxford Institute for Energy Studies, 2022), www.oxfordenergy.org/publications/indias-mass-market-clean-mobility-initiatives-and-its-unique-customized-business-models-for-light-electric-vehicles.
-
67
Rwanda Ministry of Infrastructure, Strategic Paper on Electric Mobility Adaption in Rwanda (2021), www.mininfra.gov.rw/fileadmin/user_upload/Mininfra/Publications/Laws_Orders_and_Instructions/Transport/16062021_Strategic_Paper_for_e-mobility_adapta….
-
68
Manley et al (2022)
-
69
IEA (2022)
-
70
See for example World Gold Council, Responsible gold mining and value distribution, 2013 report (2013), www.gold.org/goldhub/research/responsible-gold-mining-and-value-distribution-2013-report.
-
71
World Gold Council (2013). Mining Shared Value has indicated these figures are representative of wider sector trends.
-
72
Jeff Geipel, Mining Shared Value, interview with authors, 25 September 2022.
-
73
Government of Canada, “Minerals Sector Employment,” January 2019, www.nrcan.gc.ca/science-data/science-research/earth-sciences/earth-sciences-resources/earth-sciences-federal-programs/minerals-sector-employment/16739; Mets Ignited, “METS in Australia,” accessed 28 September 2022, www.metsignited.org/australian-mets-sector/.
-
74
Aaron Cosbey and Isabelle Ramdoo, Guidance for Governments: Local Content Policies (Intergovernmental Forum on Mining, Minerals, Metals and Sustainable Development, 2018), igf-guidance-for-governments-local-content.pdf; International Finance Corporation, Guide to Getting Started in Local Procurement (2011), www.ifc.org/wps/wcm/connect/topics_ext_content/ifc_external_corporate_site/sustainability-at-ifc/publications/publications_handbook_guidetogettingsta…; Mining Shared Value and Engineers Without Borders, The Mining Local Procurement Reporting Mechanism (LPRM) (2017), www.miningsharedvalue.org/mininglprm.
-
75
See for example, activities of the Industrial Development Corporation (www.idc.co.za) and Anglo American’s Zimele programs (www.southafrica.angloamerican.com/our-difference/zimele)
-
76
Southern Africa Resource Watch, From Harmonisation of Policies to the Manufacturing of Lithium Batteries in Southern Africa: Collaboration between DRC and Zambia (2022), www.sarwatch.co.za/publication/from-harmonisation-of-policies-to-the-manufacturing-of-lithium-batteries-in-southern-africa-collaboration-between-drc-….
-
77
Jeff Geipel, Mining Shared Value, interview with authors, 25 September 2022.
-
78
Giorgia Albertin et al (2021). Note that the definition of mineral-dependent does not overlap with which countries have substantial reserves of transition minerals.
-
79
Ibid. The IMF estimates the 15 mineral-rich countries earned mining revenues equals 2 percent of GDP on average. This amounts to $13 billion a year.
-
80
For example, if companies were to adhere to more responsible tax practices such as the B Team Responsible Tax Principles. See The B Team, “Advancing Responsible Tax Practice,” accessed 28 September 2022, www.bteam.org/our-work/causes/governance/advancing-responsible-tax-practice.
-
81
Yannick Bouterige, Céline de Quatrebarbes and Bertrand Laporte, Mining Taxation in Africa: What Evolution in 2018? (International Centre for Tax and Development, 2020), www.ictd.ac/publication/mining-taxation-africa-recent-evolution.
-
82
Giorgia Albertin et al (2021).
-
83
For example, a study of contracts on resourcecontracts.org revealed that Burkina Faso, Burundi, Guinea, Madagascar and Mali had agreed stabilization clauses lasting 30- 34 years on average—significantly longer than necessary to ensure the bankability of projects. Intergovernmental Forum on Mining, Minerals, Metals and Sustainable Development, Insights on Incentives: Tax Competition in Mining (2019), www.iisd.org/sites/default/files/publications/insights-incentives-tax-competition-mining.pdf; Natural Resource Governance Institute, resourcecontracts.org.
-
84
NRGI analysis using S&P Global mineral reserves and price data. Prices are near-term forecasts and therefore may be elevated compared to the longer-term trend.
-
85
NRGI analysis. On average, 16 percent of mining sales revenue has gone to tax payments. See Robert Pitman and Kaisa Toroskainen, Beneath the surface: The Case for Oversight of Extractive Industry Suppliers (Natural Resource Governance Institute, 2020) resourcegovernance.org/analysis-tools/publications/beneath-surface-oversight-extractive-industry-suppliers.
This figure aligns with estimates in other studies: Olle Östensson, Local content, supply chains, and shared infrastructure, UNU-WIDER Working Paper (United Nations University, 2017), www.researchgate.net/publication/337699966_Local_content_supply_chains_and_shared_infrastructure; Price Waterhouse Coopers, Total Tax Contribution: A study of the economic contribution mining companies make to public finances (2010), www.pwc.co.uk/assets/pdf/ttc-mining-study-1.pdf. -
86
Anthony J. Venables (2016) and Natural Resource Governance Institute (2014).
-
87
NRGI (2017), “Resource Governance Index 2017.” There was a small improvement in a smaller sample of countries covered by the 2021 edition of the Resource Governance Institute.
-
88
Anna Fleming, Thomas Lassourd and David Manley, “Variable Royalties: an Answer to Volatile Mineral Prices?” in Handbook on the Future of Resource Taxation, African Tax Administration Forum and Intergovernmental Forum on Mining, Minerals, Metals and Sustainable Development (forthcoming),www.iisd.org/publications/brief/future-resource-taxation-roadmap.
-
89
Robert Pitman, “Contract Disclosure Policy and Practice Tracker,” accessed 15 October 2022, docs.google.com/spreadsheets/d/1FXEeD43jw6VYHV8yS-8KJ5-rR5l0XtKxVQZBWzr-ohY.
-
90
Based on membership of the Extractive Industries Transparency Initiative (www.eiti.org/countries).
-
91
Natural Resource Governance Institute, “Chile country profile,” accessed 5 October 2022, www.resourcegovernanceindex.org/country-profiles/CHL/mining.
-
92
Transparency International, “Corruption Perceptions Index 2021,” www.transparency.org/en/cpi/2021.
-
93
United Nations Office on Drugs and Crime, Corruption and Sustainable Development (no date), www.anticorruptionday.org/documents/actagainstcorruption/print/corr18_fs_DEVELOPMENT_en.pdf
-
94
K.C. Michaels, Louis Maréchal and Benjamin Katz, “Why is ESG so important to critical mineral supplies, and what can we do about it?” (International Energy Agency, 2022) www.iea.org/commentaries/why-is-esg-so-important-to-critical-mineral-supplies-and-what-can-we-do-about-it
-
95
Extractive Industries Transparency Initiative, Making the grade: Strengthening governance of critical minerals, www.eiti.org/documents/strengthening-governance-critical-minerals.
-
96
Extractive Industries Transparency Initiative, EITI Standard 2019, eiti.org/collections/ eiti-standard#EITI-Requirements-2019; Organisation for Economic Co-operation and Development, OECD Due Diligence Guidance for Responsible Supply Chains of Minerals from Conflict-Affected and High-Risk Areas (2016), www.oecd.org/daf/inv/mne/OECD-Due-Diligence-Guidance-Minerals-Edition3.pdf; Alexandra Gillies, Sebastian Sahla, Matthieu Salomon and Tom Shipley, Diagnosing Corruption in the Extractive Sector: A Tool for Research and Action (Natural Resource Governance Institute, 2021) www.resourcegovernance.org/analysis-tools/publications/diagnosing-corruption-extractive-sector-tool-research-and-actionrespectively.
-
97
Colombia National Mining Agency, Management and Corruption Risk Matrices of the ANM approved by the Institutional Management
and Performance Committee on 01/27/2022 (2022), www.anm.gov.co/?q=documentos_para_comentarios_ciudadania; Robert Pitman and Kaisa Toroskainen, “BHP, Others Increase Scrutiny of Subcontracting Corruption Risks” (Natural Resource Governance Institute, 2018) www.resourcegovernance.org/blog/bhp-others-increase-scrutiny-subcontracting-corruption-risks. -
98
Alexandra Gillies, “Will Extractive Companies Move Away from Corruption- Prone Intermediaries?”, (Natural Resource Governance Institute, 2019) www.resourcegovernance.org/blog/extractive-companies-corruption-intermediaries-middlemen-oil.
-
99
Natural Resource Governance Institute, Anticorruption Guidance for Partners of State-Owned Enterprises (2022), soe-anticorruption.resourcegovernance.org/chapters/avoiding-high-risk-agents
-
100
Favour Ime and Louise Russell-Prywata, “Beneficial ownership transparency and the fight against grand corruption in Nigeria” (Open Ownership, 2022), www.openownership.org/en/blog/beneficial-ownership-transparency-and-the-fight-against-grand-corruption-in-nigeria.
-
101
Nqobile Dludla, “South Africa mine dam wall collapses, Killing 1 and injuring 40,” Reuters, 11 September 2022, www.reuters.com/world/africa/south-africa-mine-dam-wall-collapses-killing-three-injuring-40-2022-09-11.
-
102
Kirsten Hund and Erik Reed, “A low-carbon future must protect the world’s forests” (World Bank, 2019), www.blogs.worldbank.org/voices/low-carbon-future-must-protect-worlds-forests.
-
103
NRGIcalculationsusingscope1,2and3 emissions (excluding fugitive methane and emissions from the combustion of coal) reported by Lindsay Delevingne, Will Glazener, Liesbet Grégoir and Kimberly Henderson, “Climate risk and decarbonisation: What every mining CEO needs to know,” McKinsey & Company, 2020 www.mckinsey.com/business-functions/sustainability/our-insights/climate-risk-and-decarbonization-what-every-mining-ceo-needs-to-know. Total global emissions are for 2019 from Climate Watch, “Global Historical Emissions,” accessed 18 September 2022, www.climatewatchdata.org/ghg-emissions?end_year=2019&start_year=1990.
-
104
See for example, Éléonore Lèbre, Martin Stringer, Kamila Svobodova, John R. Owen, Deanna Kemp, Claire Côte, Andrea Arratia-Solar and Rick K. Valenta, “The social and environmental complexities of extracting energy transition metals,” Nature Communications, 11: 4823 (2020), www.nature.com/articles/s41467-020-18661-9#MOESM1.
-
105
IEA (2021)
-
106
Ibid.
-
107
World Bank, “Climate Change Knowledge Portal,” accessed 28 September 2022, www.climateknowledgeportal.worldbank.org.
-
108
NRGI (2017)
-
109
Cameroon is one exception, with its new cadastre system preventing licenses being granted that overlap protected areas. Several companies also have a no-go policy, though only for World Heritage sites. See for example ICMM, “ICMM calls for stronger legal protection of World Heritage Sites,” 2016, www.icmm.com/en-gb/news/2016/icmm-calls-for-protection-of-world-heritage-sites.
-
110
Abbi Buxton, People and nature first: safeguards needed in mining exploration (International Institute for Environment and Development, 2021) www.iied.org/20736iied.
-
111
See for example in Colombia: Lorenzo Cotula, Investment disputes from below: whose rights matter? (International Institute for Environment and Development, 2020), www.iied.org/investment-disputes-below-whose-rights-matter.
-
112
Nicola Woodroffe and Tim Grice, Beyond Revenues: Measuring and Valuing Environmental and Social Impacts in Extractive Sector Governance (Natural Resource Governance Institute, 2019), www.resourcegovernance.org/analysis-tools/publications/beyond-revenues-measuring-environmental-social-impacts.
-
113
IFC, E&S Performance Standards (2012), www.ifc.org/wps/wcm/connect/topics_ext_content/ifc_external_corporate_site/sustainability-at-ifc/policies-standards/performance-standards; IGF, Environmental and Social Impact Assessments (2020), www.igfmining.org/our-work/environmental-and-social-impact-assessments.
-
114
Daniel Whyte, “Forest finance: how Gabon earned the first payment for conservation in Africa,” Climate Tracker, 8 December 2021, www.climatetracker.org/forest-protection-first-payment-gabon-africa.
-
115
See for example Taako Edema George, Kiemo Karatu, and Andama Edward, “An evaluation of the environmental impact assessment practice in Uganda: challenges and opportunities for achieving sustainable development,” Heliyon 6(9), 2020, www.ncbi.nlm.nih.gov/pmc/articles/PMC7505666.
-
116
See for example Organisation for Economic Co-operation and Development, Guiding Principles for Durable Extractive Contracts (2019), www.oecd.org/dev/Guiding_Principles_for_durable_ extractive_contracts.pdf; United Nations Human Rights Office
of the High Commissioner, Principles for Responsible Contracts: Integrating the Management of Human Rights Risks into State-Investor Contract Negotiations- Guidance for Negotiators (2015), www.ohchr.org/%20Documents/Publications/Principles_ResponsibleContracts_HR_PUB_15_1_EN.pdf; and NRGI (2014). -
117
See for example Reuters, “South Africa’s Gold Fields bets on solar to cut costs and carbon,” 13 October 2022, www.reuters.com/business/sustainable-business/south-africas-gold-fields-bets-solar-cut-costs-carbon-2022-10-13.
-
118
U.N. Climate Change Conference UK 2021, “Glasgow Leaders’ Declaration on Forests and Land Use,” 2021, ukcop26.org/glasgow-leaders-declaration-on-forests-and-land-use.
-
119
Frances Seymour, Tony La Vina and Kristen Hite, Evidence linking community-level tenure and forest condition: An annotated bibliography (Climate and Land Use Alliance, 2015), www.climateandlandusealliance.org/wp-content/uploads/2015/08/Community_level_tenure_and_forest_condition_bibliography.pdf.
-
120
Peter G. Veit, “9 Facts about Community Land and Climate Mitigation” (World Resources Institute, 2021) files.wri.org/d8/s3fs-public/2021-10/9-facts-about-community-land-and-climate-mitigation.pdf.
-
121
Development Bank of Southern Africa, African Environmental Assessment Legislation Handbook: Consultation Draft, 2021, www.dbsa.org/african-environmental-assessment-legislation-handbook.
-
122
United Nations Development Programme, Participatory Environmental Monitoring Committees in Mining Contexts, 2019, www.undp.org/publications/participatory-environmental-monitoring-committees-mining-contexts.
-
123
Jonathan Watts, “Murders of environment and land defenders hit record high,” The Guardian, 13 September 2021, www.theguardian.com/environment/2021/sep/13/murders-environment-land-defenders-record-high.
-
124
NRGI (2017), “Resource Governance Index 2017.” There was a small improvement in a smaller sample of countries covered by the 2021 edition of the Resource Governance Institute.
-
125
With a gold price of USD 1,600 per ounce.
-
126
With a low-profit mine and a gold price of $1,600 per ounce.
-
127
Cecilia Jamasmie, “Petra Diamonds’ stake in Williamson to shrink as part of deal with Tanzania,” Mining.com, 13 December 2021, www.mining.com/petra-diamonds-stake-in-williamson-to-shrink-as-part-of-deal-with-tanzania.
-
128
Lifezone Metals, “Kabanga Nickel Signs Framework Agreement,” 19 January 2021, www.lifezonemetals.com/kabanga-nickel-signs-framework-agreement.
-
129
Thomas Scurfield and Silas Olan’g, “Magufuli Seeks the Right Balance for Tanzania’s Mining Fiscal Regime,” NRGI, 31 January 2019, www.resourcegovernance.org/blog/magufuli-seeks-right-balance-tanzania-mining-fiscal; Thomas Scurfield, “Tanzania Strikes a Better Balance with its Mining Fiscal Regime,” NRGI, 24 June 2020, www.resourcegovernance.org/blog/tanzania-strikes-better-balance-mining-fiscal-regime.
-
130
This framework agreement was published in a document setting out Barrick’s offer to buy the shares it did not already own in Acacia Mining, the previous owner of the Bulyanhulu, Buzwagi and North Mara mines in Tanzania. See Acacia Mining and Barrick Gold, Recommended Final Offer for Acacia Mining Plc by Barrick Gold Corporation, 2019, 66–79, s25.q4cdn.com/322814910/files/doc_downloads/acacia/Acacia-2.7-announcement.pdf.
-
131
The main revenue streams are import duty, skills development levy, royalty, corporate income tax, a share of dividends and shareholder loan repayments through state equity, and dividend withholding tax.
-
132
The earlier in time a shilling (Tanzania’s official currency unit) is received, the more it is worth. This is, first, because it can be used earlier; and second, because the future is uncertain, and no one can be sure they will receive that shilling in the future. To account for this time value of money, a “discount rate” is applied. In the sharing arrangement, this would mean that if the government received a shilling in year 1, the company would need to receive more than a shilling in year 2 for the benefits to be comparable. However, given cumulation here is based on actual cash flow, the company would need to receive only a shilling in year 2 for the benefits to be shared equally.
-
133
This provision for the company to earn its minimum return before sharing is triggered means Ecuador’s mechanism is similar to an R-based cash flow tax, commonly referred to as a Brown Tax. See, e.g., Robin Broadway and Michael Keen, “Theoretical perspectives on resource tax design,” in The Taxation of Petroleum and Minerals: Principles, Problems and Practice, edited by Philip Daniel, Michael Keen and Charles McPherson (Oxford: Routledge, 2010), 13–74.
-
134
Prices are taken from World Bank, “Commodities Price Data (The Pink Sheet),” www.worldbank.org/en/research/commodity-markets.
-
135
With a gold price of $1,600 per ounce.
-
136
With a gold price of $1,600 per ounce.
-
137
With a gold price of $1,600 per ounce.
-
138
The Fraser Institute survey estimates that, unless there are extremely harmful policies, around 60 percent of an investment decision tends to be based on a country’s geology. The other 40 percent comprises of several other factors, including political stability and policy predictability (given they affect the risk that investors will not be able to secure future returns generated by their investments), a conducive business environment and the tax level. See Julio Mejia and Elmira Aliakbari, Fraser Institute Annual Survey of Mining Companies 2022, (Fraser Institute, 2023), 8, www.fraserinstitute.org/studies/annual-survey-of-mining-companies-2022.
-
139
However, information gaps make it difficult for taxes to be structured to capture all excess profit. See Jean-Franҫois Wen, Progressive Taxation of Extractive Resources as Second-Best Optimal Policy (International Monetary Fund, 2018), www.imf.org/en/Publications/WP/Issues/2018/06/13/Progressive-Taxation-of-Extractive-Resources-as-Second-Best-Optimal-Policy-45923.
-
140
Recent research provides a sense of the potential revenue loss to governments from tax avoidance. The International Monetary Fund recently estimated that sub-Saharan African mining countries could be losing between $450 and $730 million in corporate income tax a year. See Sebastian Beer and Dan Devlin, Is There Money on the Table? Evidence on the Magnitude of Profit Shifting in the Extractive Industries (International Monetary Fund, 2021), www.imf.org/en/Publications/WP/Issues/2021/01/15/Is-There-Money-on-the-Table-Evidence-on-the-Magnitude-of-Profit-Shifting-in-the-Extractive-49983.
-
141
It is perhaps surprising that Tanzania’s 50-50 sharing arrangement generates an AETR greater than 50 percent (with a discount rate of 10 percent). This is despite AETR measuring government take as the share of pre-tax profits, which is larger than “economic benefits” (given economic benefits exclude interest payments). This outcome results from the 50-50 split being based on actual cash flow. The government receives revenue before the mining company through input and production taxes that do not depend on the mine making a profit. Because of these earlier revenues, the government receives a larger share on a discounted basis.
-
142
As reported in the S&P Global database. Legal risks are “expropriation, state contract alteration and contract enforcement risks.” Tax risks are “tax increase and tax inconsistency risks.” Control Risks scores these risks as still “very high” and “high” respectively (following Tanzania’s overhaul of extractives sector laws and other actions against existing mines in 2017) but reducing.
-
143
With a discount rate of 10 percent. While Ecuador’s sharing mechanism does not account for the labor profit share because none of it will go to the government from 2024 onwards, I have included it in the AETR because it is a tax on the project. The Democratic Republic of Congo regime has an excess profits tax that is triggered for a mine when the realized price is at least 25 percent higher than the price in its feasibility study. I assumed that the feasibility study has a price of $1,300 per ounce, so the excess profits tax is not triggered.
-
144
Total benefits in this case are a project’s revenues minus operating costs and replacement capital (but not minus exploration and development capital). This cash flow represents the money available to pay back the initial investment and provide a return. The government share of it is a common measure of progressivity.
-
145
Wen, Progressive Taxation of Extractive Resources as Second-Best Optimal Policy.
-
146
With a discount rate of 10 percent. The results for only some countries are shown to clearly depict each data point. The results for all the evaluated countries can be found in my model.
-
147
Scurfield, “Tanzania Strikes a Better Balance with its Mining Fiscal Regime.”
-
148
This feature is not fully reflected in Figure 5 given that “total benefits” use a slightly different definition of profits and are based on discounted cash flows.
-
149
With a gold price of $1,600 per ounce.
-
150
For example, an average 62 percent of respondents to the Fraser Institute surveys between 2017 and 2019 said the current implementation of Tanzania’s legal system would strongly discourage investment, and 73 percent said regulatory uncertainty would. See, e.g., Ashley Stedman, Jairo Yunis and Elmira Aliakbari, Fraser Institute Annual Survey of Mining Companies 2019 (Fraser Institute, 2020), www.fraserinstitute.org/studies/annual-survey-of-mining-companies-2019.
-
151
With a low-profit mine and a gold price of $1,600 per ounce.
-
152
Tax avoidance could extend the Philippines’ recovery period, and therefore delay the payment of some taxes including import duty and interest withholding tax, given the end of the recovery period depends on the reported profitability of a mine rather than an ex-ante assessment. However, the rule that the recovery period must end five years from the start of production regardless of whether pre-production expenses have been recouped limits the extent to which it can be extended.
-
153
The merits of these measures require further scrutiny. E.g., taking a share of loan repayments could result in lenders charging a higher interest rate to ensure they still recoup their loan and a minimum return. This would not only reduce taxable income but also make it harder for the government to assess whether an interest rate is reasonable, because it would not be comparable with industry benchmarks. It can also be difficult for a government to always determine whether a loan is from a related party or not. However, these considerations are outside the scope of this analysis.
-
154
Natural Resource Governance Institute (NRGI), Natural Resource Charter, 2nd edition, 2014, resourcegovernance.org/analysis-tools/publications/natural-resource-charter-2nd-ed.
-
155
Although its exclusion of several significant taxes from the government’s share of benefits means low-profit mines may still be impacted.
-
156
With a gold price of $1,600 per ounce.
-
157
Anna Fleming, Thomas Lassourd and David Manley, “Variable Royalties: an Answer to Volatile Mineral Prices?” in Handbook on the Future of Resource Taxation, African Tax Administration Forum and Intergovernmental Forum on Mining, Minerals, Metals and Sustainable Development (forthcoming), www.iisd.org/publications/brief/future-resource-taxation-roadmap.
-
158
Ensuring that interest rates used as a comparison apply to comparable assets with a similar risk profile is challenging, but rules of this nature have been successful in reducing profit shifting in other countries. See Beer and Devlin, Is There Money on the Table?.
-
159
The main taxes listed are VAT, royalty and corporate income tax. The regime also includes a share of pre-tax profits that is currently divided between the company’s workers and the government, with the portion received by the government included in its accumulated benefits. However, a recent court ruling means that all this labor profit share will go to workers from the start of 2024 and therefore none of it will be included in government benefits.
-
160
The discount rate used is specific to each mine and based on its weighted average cost of capital (WACC). I have assumed that WACC is around 7 percent in real terms. This is based on the typical discount rate for equity shareholders used by industry and government analysts of 8 percent in real terms, and the current average cost of debt for the mining sector as reported by Aswath Damodaran, Damodaran Online, www.pages.stern.nyu.edu/~adamodar.
-
161
Republic of the Philippines, Financial or Technical Assistance Agreement, mgb.gov.ph/attachments/article/79/PFC_FTAA.pdf.
-
162
For example, some terms in the original FTAA for an OceanaGold mine differed in some areas: Republic of the Philippines, Financial or Technical Assistance Agreement with Arimco Mining Corporation, 1994, www.resourcecontracts.org/contract/ocds-591adf-2792396017. I understand that the recently signed extension to this agreement has slightly different terms again.
-
163
A template of the FARI model and a user guide that explains all the concepts and workings of the model are available at International Monetary Fund, “Fiscal Analysis of Resource Industries,”www.imf.org/external/np/fad/fari.
How Africa’s Resource-Rich Countries and Partners Can Turn the Nairobi Declaration into Concrete Progress

The inaugural Africa Climate Summit (ACS), which took place earlier this month, marked a significant milestone in the continent’s climate dialogue. Bringing together 18 heads of state, experts from various sectors, civil society representatives, global climate leaders and development partners, the summit resulted in the Nairobi Declaration on Climate Change and Call to Action.
This declaration committed participating governments to accelerating climate-positive growth, strengthening coordination across the continent, and mainstreaming adaptation into development policies. It called upon Africa’s partners to meet their climate finance commitments and reduce bottlenecks that have prevented African countries from accessing funds to deploy renewable energy and other necessary technologies.
This week the baton passed from Nairobi to New York. The outcomes and lessons drawn from ACS hold significant relevance for delegates to the UN Climate Ambition Summit convened by U.N. Secretary-General António Guterres. In the Nairobi Declaration Africa’s leaders illuminate critical pathways toward sustainable climate action, offering valuable insights that can inform and inspire the discussions, commitments and decisions in New York.
For Africa’s resource-rich nations, heavily dependent on mineral and fossil fuel extraction, the Nairobi summit presented an opportunity to explore a transition toward cleaner and sustainable energy sources.
However, skepticism prevailed among civil society activists and representatives of African regional institutions who felt that they had heard similar promises before from African governments and the international donor community. In the lead-up to the summit, NRGI suggested five areas of focus for resource-rich countries. Reflecting on the summit’s outcomes, here we highlight three steps that African governments, regional institutions, activists and international donors can take to translate the Nairobi Declaration into impactful measures for resource-rich African countries, in anticipation of December’s COP28 and beyond.
1. Open up space for public dialogue
The Nairobi Declaration recognizes the dual challenge faced by African countries, including resource-rich ones: the need to accelerate climate mitigation and adaptation while promoting economic development and energy access. This requires mechanisms for public involvement in just transition planning and an inclusive, people-centered vision for the transition that prioritizes fair distribution of benefits and costs; protects vulnerable communities; promotes skill development, decent jobs, equity and social inclusion; and ensures active public engagement. Unfortunately, in many resource-rich countries, decision-making around energy transition planning has remained confined to the corridors of power walked by policy makers and political elites.
The Nairobi summit regrettably failed to significantly advance public dialogue on energy transition. Despite calls from African activists for meaningful representation of civil society and communities on the front lines of climate impact, the summit was dominated by high-level government officials and investors, with limited space for discussions on the human impact of climate change and the governance of the transition from a people-centered perspective.
Moving forward, African governments must establish open consultative mechanisms for public engagement in understanding energy transition opportunities and challenges. Failure to do so could allow special interests to dominate policy processes and deepen citizens’ distrust.
International institutions, including the African Union and multilateral development banks, as well as donors, must prioritize governance and public participation in future milestone meetings. They should ensure adequate funding for national and local participatory processes in advance of such events and as part of national transition planning. Democratizing the energy transition agenda, aligning it with people’s aspirations, and securing broad-based support are imperative to navigate the complexities and build a sustainable and equitable future.
To accelerate global capital mobilization effectively and address the crises of climate change and development, decisive action on inclusive and effective international tax cooperation is essential. For example, United Nations Resolution A/C.2/77/L.11/REV.1 aims to reduce Africa’s annual loss of $27 billion in corporate tax revenue by at least 50 percent by 2030 and 75 percent by 2050 through curbing profit shifting.
2. Get specific
While the Nairobi Declaration touches on key drivers of change for resource-rich countries, it lacks specificity. Notably, the signatories omitted from the final version references to accelerating the development and value addition of Africa’s green transition minerals. While the declaration vaguely alludes to this goal, calling for more energy-intensive processing of Africa’s raw materials to take place on the continent, it falls short of outlining specific goals related to transition minerals and commitments from African governments and institutions. The continent’s governments must cooperate and coordinate to develop economically viable cross-border value chains.
The African Union’s Green Minerals Strategy, presented at the summit, can serve as a crucial tool for aligning government policies. Nevertheless, African officials must commit to specific actions to harmonize policies, promote cross-border collaboration, develop costed plans for value addition, and establish governance priorities. This push requires coordination among regional institutions and individual governments, emphasizing good governance, transparency, and public dialogue to avoid repeating the mistakes of past resource booms. Development partners must support African governments and civil society in strengthening policies, enforcement, and public oversight to prevent a one-sided geopolitical game.
Another central theme at the summit was climate finance, emphasized in the declaration’s calls for global capital mobilization, honoring unmet global finance commitments, and reducing the risks and costs of green investments for African governments. While donor nations and multilateral organizations present pledged approximately USD 26 billion at the summit, these promises must translate into tangible support to realize greenhouse gas reductions in Africa. Resource-rich countries must closely examine the intersection of public revenues, investment plans and transition ambitions, developing clear agendas to mobilize and use finance strategically. People-centered planning processes are crucial to building national consensus and leveraging external funding opportunities. Just energy transition partnerships (JETPs) can play a pivotal role in this process, exemplified by the JETP in Senegal, which can serve as a test case for scaling up energy access and renewable deployment. Achieving this will require governments’ commitment to transparency and public engagement to ensure that JETPs serve public rather than vested interests.
International efforts to combat illicit financial flows and boost domestic resource mobilization—such as the Addis Ababa agenda and the UN resolution on international tax cooperation—can play an important role in leveling the playing field and boosting African governments’ efforts to finance a just transition. But multi-national companies must vigorously implement them, and bolstering government enforcement capacity is essential. Policies requiring company reporting on their tax payments on a country-by-country basis and publication of beneficial ownership information are also needed. And the demand for transition minerals necessitates accelerated steps toward operationalizing the automatic exchange of tax information.
3. Get organized
African leaders can navigate the energy transition successfully, establish sustainable and resilient energy systems, and contribute to a more environmentally friendly and prosperous future, in line with the African Union’s Agenda 2063. However, achieving this vision will require the continent’s political leadership to organize better and develop clear agendas.
It also requires the involvement of citizens and civil society. To secure an equitable energy transition and to advance climate action, civil society organizations (CSOs) can:
- Invest in collaborative coalitions. Form coalitions that bring together organizations, activists, and individuals committed to advancing the energy transition agenda. Collaborate with experts in climate change, renewable energy, environmental justice, and related fields to create a united front that can effectively engage and exert pressure on regional and international authorities to expand consultation and decision-making spaces for diverse representation.
- Increase awareness and skills. Recognize the varying levels of awareness and understanding of the impact of a just energy transition among different groups. Launch a comprehensive awareness-raising, skills enhancement, and advocacy campaign to educate stakeholders about the implications of the transition in Africa. Invest in mobilizing grassroots support through community engagement to ensure local communities are informed advocates for clean energy solutions, effectively influencing decision-makers.
- Participate and engage decision makers. Establish effective communication channels with government policymakers, regional institutions, and other stakeholders involved in climate negotiations and energy policy. Advocate for inclusivity in decision-making processes and civil society participation and representatives in official delegations and advisory committees.
- Shape the narrative. Invest in research and development to generate evidence-based policy recommendations that support the energy transition agenda from an African perspective, considering regional nuances. Collaborate with experts in energy, economics and environmental science to create robust proposals tailored to the African context.
- Deepen international collaboration. Form partnerships with international organizations, NGOs and climate-focused institutions that can provide resources, expertise and global visibility. Collaborating with international allies helps to amplify messages and drive support.
- Monitor progress and demand accountability. Continuously monitor government and corporate commitments to the energy transition agenda. Use the Nairobi Declaration as a foundation to hold governments and international institutions accountable. Recognize that energy transition and climate advocacy are long-term efforts and be prepared to adapt strategies as circumstances evolve.
Turning the Nairobi Declaration into concrete progress for Africa’s resource-rich countries demands a holistic approach. It requires public dialogue, participation, representation with key actors and civil society organizing to actively engage in shaping the transition. Governments, international partners and corporations must collaborate to ensure that the energy transition benefits all and contributes to a sustainable, equitable future for Africa.
Notes
-
1
International Energy Agency, The Role of Critical Minerals in Clean Energy Transitions (2021), www.iea.org/reports/the-role-of-critical-minerals-in-clean-energy-transitions.
-
2
In this report we refer to both Africa north and south of the Sahara. When we mean one of the sub-regions we specify as such.
-
3
IEA (2021); Clyde Russell, “Mining is key to energy transition, but it’s still unloved,” Reuters, 11 May 2022, www.reuters.com/business/energy/mining-is-key-energy-transition-its-still-unloved-russell-2022-05-11; Jairo Yunis and Elmira Aliakbari, Annual Survey of Mining Companies 2020 (Fraser Institute, 2021), www.fraserinstitute. org/studies/annual-survey-of-mining-companies-2020.
-
4
See, for example, Natural Resource Governance Institute, Natural Resource Charter 2nd edition (2014), resourcegovernance.org/approach/natural-resource-charter.
-
5
Natural Resource Governance Institute, Resource Governance Index: From Legal Reform to Implementation in Sub-Saharan Africa (2018), resourcegovernance.org/sites/default/files/documents/rgi-from-legal-reform-to-implementation-sub-saharan-africa.pdf.
-
6
Africa Climate Foundation, Geopolitics of Critical Minerals in Renewable Energy Supply Chains (2022), africanclimatefoundation.org/news_and_analysis/geopolitics-of-critical-minerals-in-renewable-energy-supply-chains/.
-
7
See for example, Cooper Inveen, “Atlantic Lithium’s Ghana mine poised to being production by 2024,” Reuters, 20 September 2022, www.reuters.com/article/ghana-mining-lithium/atlantic-lithiums-ghana-mine-poised-to-begin-production-by-2024-idUSKBN2QV0NQ?utm_source=substack&utm_me….
-
8
As demonstrated by recent discussions between a U.S.-led group of rich countries and mineral producers such as the Democratic Republic of Congo, Namibia and Tanzania. Julian Pecquet, “US looks to Africa to
diversify supply chain for critical minerals,” The Africa Report, 23 September 2022. www.theafricareport.com/243847/us-looks-to-africa-to-diversify-supply-chain-for-critical-minerals. -
9
Glada Llahn and Paul Stevens, The curse of the one-size-fits-all fix, UNU-WIDER Working Paper (United Nations University, 2017), www.wider.unu.edu/sites/default/files/wp2017-21.pdf. For further assessment of donors’ activities in the past, both positive and negative lessons, see: Joanna Buckley, Neil McCulloch and Nick Travis, Donor-supported approaches to improving extractives governance, UNU-WIDER Working Paper (United Nations University, 2017), www.wider.unu.edu/sites/default/files/wp2017-33.pdf; Siân Herbert and Laura Bolton, Donor activity in the extractives sector (Knowledge, evidence and learning for development, 2018), opendocs.ids.ac.uk/opendocs/bitstream/handle/20.500.12413/13589/Donor_activity_in_the_extractives_sector.pdf.
-
10
Although this estimate includes emissions resulting from the investments by each group. Lucas Chancel, “Global carbon inequality over 1990–2019,” Nature Sustainability (2022), doi. org/10.1038/s41893-022-00955-z.
-
11
For Further reading on this dilemma and the arguments between the proponents of “green growth” and “degrowth, see: Alex Bowen and Samuel Fankhauser, “The Green Growth Narrative: Paradigm Shift or Just Spin? Global Environmental Change-human and Policy Dimensions,” Global Environmental Change, 21 (2021), 1157-1159, DOI: I:10.1016/j. gloenvcha.2011.07.007; Kate Raworth, Doughnut Economics: Seven Ways to Think Like a 21st Century Economist, Random House Business Books, London, 2017; Jason Hickel, “What does degrowth mean? A few points of clarification,” Globalizations, 18:7 (2021), 1105-1111, DOI: 10.1080/14747731.2020.1812222.
-
12
McKinsey & Company, “The raw-materials challenges: How the metals and mining sector will be at the core of enabling the energy transition” (2022), www.mckinsey. com/industries/metals-and-mining/our-insights/the-raw-materials-challenge-how-the-metals-and-mining-sector-will-be-at-the-core-of-enabling-the-energy-transition.
-
13
McKinsey & Company, “Metal mining constraints on the electric mobility horizon” (2018), www.mckinsey.com/industries/oil-and-gas/our-insights/metal-mining-constraints-on-the-electric-mobility-horizon.
-
14
McKinsey (2018)
-
15
NRGI analysis, based on Net Zero Tracker. “Net Zero Tracker,” Energy and Climate Intelligence Unit, Data-Driven EnviroLab, NewClimate Institute, Oxford Net Zero (2022), zerotracker.net
-
16
Pratima Desai, “Low carbon world needs $1.7 trillion in mining investment,” Reuters, 10 May 2021, www.reuters.com/business/energy/low-carbon-world-needs-17-trillion-mining-investment-2021-05-10/
-
17
Based on S&P Global Market Intelligence data and U.S. Geological Survey, Mineral Commodity Summaries 2022, 2022, www.pubs.er.usgs.gov/publication/mcs2022. These sources sometimes differ significantly. An average is taken when the reported amounts are similar. When they are not, a third source is used to determine which is likely to be more accurate.
-
18
NRGI analysis based on reserves reported in the S&P Globaldatabase and U.S. Geological Survey (2022), and the mineral volumes in a standard electric vehicle in IEA (2021).
-
19
See for example, World Bank, “New World Bank Survey Brings Hope to Malawi’s Mineral Potential,” 22 September 2015, www.worldbank.org/en/news/feature/2015/09/22/new-world-bank-survey-brings-hope-to-malawis-mineral-potential.
-
20
International Energy Agency, Global Supply Chains of EV Batteries (2022), www.iea.org/reports/global-supply-chains-of-ev-batteries.
-
21
African Minerals Development Centre (AMDC), “Unveiled: The #AMDC’s Theory of Change: A prosperous and transformed Africa achieved through sustainable development of mineral and energy resources...” Twitter post (11 October 2022), www.twitter.com/AfricanAmdc/status/1579789353584164864.
-
22
Based on S&P Global data and U.S. Geological Survey (2022). These sources sometimes differ significantly. An average is taken when the reported amounts are similar. When they are not, a third source is used to determine which is likely to be more accurate.
-
23
The correlation between exploration and mineral reserves per square kilometer is 0.79. The figure compares exploration for all metals except gold from 2002 to 2021 with current value of transition mineral reserves. Exploration spend, reserves and prices from S&P Global Market Intelligence; land area data from www.worldpopulationreview.com.
-
24
The correlation between the Resource Governance Index and Policy Potential Index scores is 0.5. The NRGI Resource Governance Index measures the transparency and accountability of mining institutions. The Policy Potential Index (PPI) in the Fraser Institute survey shows the attractiveness of a country’s policies to investors. The PPI score reported in the figure is an average of the scores from 2017 to 2021 where available, and average across jurisdictions for countries that have several. Some countries have low survey response rates, between 5 to 9 respondents. Natural Resource Governance Institute, “Resource Governance Index 2017,” 2017, resourcegovernanceindex.org; Yunis and Aliakbari (2021).
-
25
African Minerals Development Centre, Desktop Review of African Geological Survey Organisation Capacities and Gaps (United Nations Economic Commission for Africa, 2018), archive.uneca.org/publications/desktop-review-african-geological-survey-organisation-capacities-and-gaps.
-
26
Antony Sguazzin, “South Africa Sets 900 Million Annual Mineral Exploration Target,” Bloomberg, 12 April 2022, www.bloomberg.com/news/articles/2022-04-12/s-africa-sets-900-million-annual-mineral-exploration-target.
-
27
Oil exploration investment is known to correlated strongly with the quality of governance in a country, and it seems likely that a similar pattern holds for mineral exploration. See James Cust and Harding Torfinn, “Institutions and the Location of Oil Exploration”, Journal of the European Economic Association (2019).
-
28
Richard Schodde, “Key issues affecting the time delay between discovery and development – is it getting harder and longer?” PDAC 2014, 3 March 2014, Toronto. minexconsulting.com/wp-content/uploads/2019/04/Schodde-presentation-to-PDAC-March-2014.pdf
-
29
Summary of five studies. The outlier is the McKinsey study (7 to 10 years), but this was based on “large-scale greenfield assets” only. Like findings of Schodde (2021), which highlights that large projects are quicker. McKinsey (2022); IEA (2021); Tehmina Khan, Trang Nguyen, Franziska Ohnsorge, and Richard Schodde, “From Commodity Discovery to Production,” Policy Research Working Paper (World Bank, 2016); Paul Manalo, “Top mines average time from discovery to production: 16.9 years,” Metals and Mining Research S&P Global Market Intelligence (2020); Schodde (2014).
-
30
IEA (2021)
-
31
Schodde (2021) and Khan et al. (2016)
-
32
David Humphreys, “The mining industry and the supply of critical minerals,” Critical Minerals Handbook, Gus Gunn (ed.), chapter 2, 2013.
-
33
Khan et al. (2016)
-
34
Several of the experts interviewed for this report suggested that this is the main opportunity for shortening lead times.
-
35
David Manley, Patrick R.P. Heller and William Davis, No Time to Waste: Governing Cobalt Amid the Energy Transition (Natural Resource Governance Institute, 2022), resourcegovernance.org/no-time-to-waste-governing-cobalt-amid-energy-transition.
-
36
Matt Renaud and Mustafa Kumral, “Out of the Comfort Zone: Quantifying Country Risk for Foreign Mining Project Investment Feasibilities,” Mining, Metallurgy & Exploration, 38, 2323-2335 (2021), www.doi.org/10.1007/s42461-021-00495-8.
-
37
Based on S&P Global data and U.S. Geological Survey (2022). These sources sometimes differ significantly. An average is taken when the reported amounts are similar. When they are not, a third source is used to determine which is likely to be more accurate.
-
38
Henry Sanderson, “Vedanta starts arbitration against Zambia after mines seized,“ Financial Times, 31 May 2019. www.ft.com/content/98b0c464-83a1-11e9-b592-5fe435b57a3b.
-
39
Julia Tilley, “Labour talks 217: Escondida and other stories,” S&P Global Market Intelligence, Metals and Mining Research, 23 February 2017.
-
40
Keval Dhokia, “Global copper pipeline challenged due to disruption,” S&P Global Market Intelligence, Metals and Mining Research, 18 June 2019.
-
41
Sudarshan Varadhan, “Indian state seeks permanent closure of Vedanta’s copper smelter: officials,” Reuters, 24 May 2018. www.reuters.com/article/us-vedanta-smelter-idUSKCN1IP1CX.
-
42
Dhokia (2019)
-
43
Misha Savic, Jan Bratanic and Thomas Biesheuvel, “Europe’s Biggest Lithium Mine Blocked as Rio Loses in Serbia,” Bloomberg, 20 January 2022, www.bloomberg.com/news/articles/2022-01-20/serbia-suspends-rio-tinto-s-2-4-billion-lithium-mine-project.
-
44
Tanzania Minerals Audit Agency, A Study on Viability to Construct a Copper Concentrate Smelter in Tanzania (2011), www.scribd.com/document/193187016/A-Study-on-Viability-to-Construct-a-Copper-Concentrate-Smelter-in-Tanzania1.
-
45
Africa Confidential, “Local processing row holds up rare earth mine,” 25 October 2022, www.africa-confidential.com/article-preview/id/14166/Local_processing_row_holds_up_rare_earth_mine.
-
46
Reuters, “Timeline: The battle for Simandou,” 22 January 2021, www.reuters.com/article/us-swiss-steinmetz-timeline-idUSKBN29R2AA.
-
47
Magnus Ericsson and Olof Löf, “Mining’s contribution to national economies between 1996 and 2016,” Mineral Economics, 223–250 (2019), doi.org/10.1007/s13563-019-00191-6.
-
48
Net savings plus education expenditure and minus energy depletion, mineral depletion, net forest depletion, and carbon dioxide and particulate emissions damage. NRGI analysis of World Bank, “World Development Indicators,” accessed 28 September 2022, www.databank.worldbank.org/source/world-development-indicators.
-
49
Anthony J. Venables, “Using Natural Resources for Development: Why Has It Proven So Difficult?” Journal of Economic Perspectives, 30:1, 161–184 (2016) doi. org/10.1257/jep.30.1.161.
-
50
Giorgia Albertin, Boriana Yontcheva, Dan Devlin, Hilary Devine, Marc Gerard, Sebastian Beer, Irena Jankulov Suljagic and Vimal V. Thakoor, Tax Avoidance in Sub-Saharan Africa’s Mining Sector, Departmental Paper No 2021/022 (International Monetary Fund, 2021), www.imf.org/en/Publications/Departmental-Papers-Policy-Papers/Issues/2021/09/27/Tax-Avoidance-in-Sub-Saharan-Africas-Mining-Sector-464850
-
51
See for example, South African Human Rights Commission, National Hearing on the Underlying Socio-economic Challenges of Mining-affected Communities in South Africa (2016), www.sahrc.org.za/home/21/files/SAHRC%20Mining%20communities%20report%20FINAL.pdf
-
52
See, for example, Claude Kabemba, “How mineral resources can fuel the development of Africa in the context of post-Covid economic recovery,” Publish What You Pay Annual Conference, 14-15 March 2021, www.sarwatch.co.za/how-mineral-resources-can-fuel-the-development-of-africa-in-the-context-of-post-covid-economic-recovery.
-
53
See, for example, African Development Bank, Request for Expressions of Interest, 2022, www.afdb.org/sites/default/files/reoi_green_minerals_strategy_approach_paper_002.pdf.
-
54
Other partners currently include African Legal Support Facility, Africa Finance Corporation, Afreximbank, United Nations Economic Commission for Africa and United Nations Development Programme.
-
55
African Development Bank, “Why Africa is the next renewables powerhouse,” 7 December 2018, www.afdb.org/en/news-and-events/why-africa-is-the-next-renewables-powerhouse-18822
-
56
Manley et al (2022)
-
57
Through Power Africa (www.usaid.gov/powerafrica), for example.
-
58
Reserves data is from S&P Global Market Intelligence and U.S. Geological Survey. The above ground assets of a country comprise its power and transport infrastructure, human capital and other productive capabilities, level of environmental protection and investment climate. They have been converted to a regional index of 0-100.
The data is from multiple sources: African Development Bank, The Africa Infrastructure Development Index (AIDI) 2020, 2020, www.afdb.org/en/documents/economic-brief-africa-infrastructure-development-index-aidi-2020-july-2020; World Bank, “World Development Indicators”; African Development Bank, Electricity Regulatory Index (ERI) for Africa, 2021, 2021, africa-energy-portal.org/reports/electricity-regulatory-index-eri-africa-2021-edition; World Intellectual Property Organization, Global Innovation Index (GII) 2021, 2021, www.wipo.int/publications/en/details.jsp?id=4560; Harvard Growth Lab, “The Atlas of Economic Complexity,” accessed 20 September 2022, www.atlas.cid.harvard.edu/; Environmental Protection Index, “2022 Environmental Protection Index (2022),” accessed 20 September 2022, www.epi.yale.edu/; World Bank, “Doing Business 2020,” accessed 20 September 2022, www.worldbank.org/en/programs/business-enabling-environment/doing-business-legacy; S&P Global, “Control Risks Country Risk Summary,” accessed 20 September 2022, www.capitaliq.spglobal.com. -
59
Southern African Development Community and African Minerals Development Centre, Developing a Regional Mining Vision for the Southern African Development Community (SADC), 2018.
-
60
Manley et al (2022)
-
61
Emily Hersh, Alex Grant and Chris Berry, So, You Want to make Batteries Too? (Payne Institute, 2020), www.payneinstitute.mines.edu/so-you-want-to-make-batteries-better-too
-
62
Ibid.
-
63
See for example, African Development Bank, Lithium-Cobalt Value Chain Analysis for Mineral Based Industrialization in Africa (2021), www.afdb.org/en/documents/lithium-cobalt-value-chain-analysis-mineral-based-industrialization-Africa.
-
64
McKinsey & Company, Power to move: Accelerating the electric transport transition in sub-Saharan Africa (2022), www.mckinsey.com/industries/automotive-and-assembly/our-insights/power-to-move-accelerating-the-electric-transport-transition-in-sub- aharan-africa.
-
65
BloombergNEF, The Cost of Producing Battery Precursors in the DRC (2021), about. bnef.com/blog/producing-battery-materials-in-the-drc-could-lower-supply-chain-emissions-and-add-value-to-the-countrys-cobalt.
-
66
Mohua Mukherjee, India’s Mass-Market Clean Mobility Initiatives and its Unique, Customized Business Models for Light Electric Vehicles (The Oxford Institute for Energy Studies, 2022), www.oxfordenergy.org/publications/indias-mass-market-clean-mobility-initiatives-and-its-unique-customized-business-models-for-light-electric-vehicles.
-
67
Rwanda Ministry of Infrastructure, Strategic Paper on Electric Mobility Adaption in Rwanda (2021), www.mininfra.gov.rw/fileadmin/user_upload/Mininfra/Publications/Laws_Orders_and_Instructions/Transport/16062021_Strategic_Paper_for_e-mobility_adapta….
-
68
Manley et al (2022)
-
69
IEA (2022)
-
70
See for example World Gold Council, Responsible gold mining and value distribution, 2013 report (2013), www.gold.org/goldhub/research/responsible-gold-mining-and-value-distribution-2013-report.
-
71
World Gold Council (2013). Mining Shared Value has indicated these figures are representative of wider sector trends.
-
72
Jeff Geipel, Mining Shared Value, interview with authors, 25 September 2022.
-
73
Government of Canada, “Minerals Sector Employment,” January 2019, www.nrcan.gc.ca/science-data/science-research/earth-sciences/earth-sciences-resources/earth-sciences-federal-programs/minerals-sector-employment/16739; Mets Ignited, “METS in Australia,” accessed 28 September 2022, www.metsignited.org/australian-mets-sector/.
-
74
Aaron Cosbey and Isabelle Ramdoo, Guidance for Governments: Local Content Policies (Intergovernmental Forum on Mining, Minerals, Metals and Sustainable Development, 2018), igf-guidance-for-governments-local-content.pdf; International Finance Corporation, Guide to Getting Started in Local Procurement (2011), www.ifc.org/wps/wcm/connect/topics_ext_content/ifc_external_corporate_site/sustainability-at-ifc/publications/publications_handbook_guidetogettingsta…; Mining Shared Value and Engineers Without Borders, The Mining Local Procurement Reporting Mechanism (LPRM) (2017), www.miningsharedvalue.org/mininglprm.
-
75
See for example, activities of the Industrial Development Corporation (www.idc.co.za) and Anglo American’s Zimele programs (www.southafrica.angloamerican.com/our-difference/zimele)
-
76
Southern Africa Resource Watch, From Harmonisation of Policies to the Manufacturing of Lithium Batteries in Southern Africa: Collaboration between DRC and Zambia (2022), www.sarwatch.co.za/publication/from-harmonisation-of-policies-to-the-manufacturing-of-lithium-batteries-in-southern-africa-collaboration-between-drc-….
-
77
Jeff Geipel, Mining Shared Value, interview with authors, 25 September 2022.
-
78
Giorgia Albertin et al (2021). Note that the definition of mineral-dependent does not overlap with which countries have substantial reserves of transition minerals.
-
79
Ibid. The IMF estimates the 15 mineral-rich countries earned mining revenues equals 2 percent of GDP on average. This amounts to $13 billion a year.
-
80
For example, if companies were to adhere to more responsible tax practices such as the B Team Responsible Tax Principles. See The B Team, “Advancing Responsible Tax Practice,” accessed 28 September 2022, www.bteam.org/our-work/causes/governance/advancing-responsible-tax-practice.
-
81
Yannick Bouterige, Céline de Quatrebarbes and Bertrand Laporte, Mining Taxation in Africa: What Evolution in 2018? (International Centre for Tax and Development, 2020), www.ictd.ac/publication/mining-taxation-africa-recent-evolution.
-
82
Giorgia Albertin et al (2021).
-
83
For example, a study of contracts on resourcecontracts.org revealed that Burkina Faso, Burundi, Guinea, Madagascar and Mali had agreed stabilization clauses lasting 30- 34 years on average—significantly longer than necessary to ensure the bankability of projects. Intergovernmental Forum on Mining, Minerals, Metals and Sustainable Development, Insights on Incentives: Tax Competition in Mining (2019), www.iisd.org/sites/default/files/publications/insights-incentives-tax-competition-mining.pdf; Natural Resource Governance Institute, resourcecontracts.org.
-
84
NRGI analysis using S&P Global mineral reserves and price data. Prices are near-term forecasts and therefore may be elevated compared to the longer-term trend.
-
85
NRGI analysis. On average, 16 percent of mining sales revenue has gone to tax payments. See Robert Pitman and Kaisa Toroskainen, Beneath the surface: The Case for Oversight of Extractive Industry Suppliers (Natural Resource Governance Institute, 2020) resourcegovernance.org/analysis-tools/publications/beneath-surface-oversight-extractive-industry-suppliers.
This figure aligns with estimates in other studies: Olle Östensson, Local content, supply chains, and shared infrastructure, UNU-WIDER Working Paper (United Nations University, 2017), www.researchgate.net/publication/337699966_Local_content_supply_chains_and_shared_infrastructure; Price Waterhouse Coopers, Total Tax Contribution: A study of the economic contribution mining companies make to public finances (2010), www.pwc.co.uk/assets/pdf/ttc-mining-study-1.pdf. -
86
Anthony J. Venables (2016) and Natural Resource Governance Institute (2014).
-
87
NRGI (2017), “Resource Governance Index 2017.” There was a small improvement in a smaller sample of countries covered by the 2021 edition of the Resource Governance Institute.
-
88
Anna Fleming, Thomas Lassourd and David Manley, “Variable Royalties: an Answer to Volatile Mineral Prices?” in Handbook on the Future of Resource Taxation, African Tax Administration Forum and Intergovernmental Forum on Mining, Minerals, Metals and Sustainable Development (forthcoming),www.iisd.org/publications/brief/future-resource-taxation-roadmap.
-
89
Robert Pitman, “Contract Disclosure Policy and Practice Tracker,” accessed 15 October 2022, docs.google.com/spreadsheets/d/1FXEeD43jw6VYHV8yS-8KJ5-rR5l0XtKxVQZBWzr-ohY.
-
90
Based on membership of the Extractive Industries Transparency Initiative (www.eiti.org/countries).
-
91
Natural Resource Governance Institute, “Chile country profile,” accessed 5 October 2022, www.resourcegovernanceindex.org/country-profiles/CHL/mining.
-
92
Transparency International, “Corruption Perceptions Index 2021,” www.transparency.org/en/cpi/2021.
-
93
United Nations Office on Drugs and Crime, Corruption and Sustainable Development (no date), www.anticorruptionday.org/documents/actagainstcorruption/print/corr18_fs_DEVELOPMENT_en.pdf
-
94
K.C. Michaels, Louis Maréchal and Benjamin Katz, “Why is ESG so important to critical mineral supplies, and what can we do about it?” (International Energy Agency, 2022) www.iea.org/commentaries/why-is-esg-so-important-to-critical-mineral-supplies-and-what-can-we-do-about-it
-
95
Extractive Industries Transparency Initiative, Making the grade: Strengthening governance of critical minerals, www.eiti.org/documents/strengthening-governance-critical-minerals.
-
96
Extractive Industries Transparency Initiative, EITI Standard 2019, eiti.org/collections/ eiti-standard#EITI-Requirements-2019; Organisation for Economic Co-operation and Development, OECD Due Diligence Guidance for Responsible Supply Chains of Minerals from Conflict-Affected and High-Risk Areas (2016), www.oecd.org/daf/inv/mne/OECD-Due-Diligence-Guidance-Minerals-Edition3.pdf; Alexandra Gillies, Sebastian Sahla, Matthieu Salomon and Tom Shipley, Diagnosing Corruption in the Extractive Sector: A Tool for Research and Action (Natural Resource Governance Institute, 2021) www.resourcegovernance.org/analysis-tools/publications/diagnosing-corruption-extractive-sector-tool-research-and-actionrespectively.
-
97
Colombia National Mining Agency, Management and Corruption Risk Matrices of the ANM approved by the Institutional Management
and Performance Committee on 01/27/2022 (2022), www.anm.gov.co/?q=documentos_para_comentarios_ciudadania; Robert Pitman and Kaisa Toroskainen, “BHP, Others Increase Scrutiny of Subcontracting Corruption Risks” (Natural Resource Governance Institute, 2018) www.resourcegovernance.org/blog/bhp-others-increase-scrutiny-subcontracting-corruption-risks. -
98
Alexandra Gillies, “Will Extractive Companies Move Away from Corruption- Prone Intermediaries?”, (Natural Resource Governance Institute, 2019) www.resourcegovernance.org/blog/extractive-companies-corruption-intermediaries-middlemen-oil.
-
99
Natural Resource Governance Institute, Anticorruption Guidance for Partners of State-Owned Enterprises (2022), soe-anticorruption.resourcegovernance.org/chapters/avoiding-high-risk-agents
-
100
Favour Ime and Louise Russell-Prywata, “Beneficial ownership transparency and the fight against grand corruption in Nigeria” (Open Ownership, 2022), www.openownership.org/en/blog/beneficial-ownership-transparency-and-the-fight-against-grand-corruption-in-nigeria.
-
101
Nqobile Dludla, “South Africa mine dam wall collapses, Killing 1 and injuring 40,” Reuters, 11 September 2022, www.reuters.com/world/africa/south-africa-mine-dam-wall-collapses-killing-three-injuring-40-2022-09-11.
-
102
Kirsten Hund and Erik Reed, “A low-carbon future must protect the world’s forests” (World Bank, 2019), www.blogs.worldbank.org/voices/low-carbon-future-must-protect-worlds-forests.
-
103
NRGIcalculationsusingscope1,2and3 emissions (excluding fugitive methane and emissions from the combustion of coal) reported by Lindsay Delevingne, Will Glazener, Liesbet Grégoir and Kimberly Henderson, “Climate risk and decarbonisation: What every mining CEO needs to know,” McKinsey & Company, 2020 www.mckinsey.com/business-functions/sustainability/our-insights/climate-risk-and-decarbonization-what-every-mining-ceo-needs-to-know. Total global emissions are for 2019 from Climate Watch, “Global Historical Emissions,” accessed 18 September 2022, www.climatewatchdata.org/ghg-emissions?end_year=2019&start_year=1990.
-
104
See for example, Éléonore Lèbre, Martin Stringer, Kamila Svobodova, John R. Owen, Deanna Kemp, Claire Côte, Andrea Arratia-Solar and Rick K. Valenta, “The social and environmental complexities of extracting energy transition metals,” Nature Communications, 11: 4823 (2020), www.nature.com/articles/s41467-020-18661-9#MOESM1.
-
105
IEA (2021)
-
106
Ibid.
-
107
World Bank, “Climate Change Knowledge Portal,” accessed 28 September 2022, www.climateknowledgeportal.worldbank.org.
-
108
NRGI (2017)
-
109
Cameroon is one exception, with its new cadastre system preventing licenses being granted that overlap protected areas. Several companies also have a no-go policy, though only for World Heritage sites. See for example ICMM, “ICMM calls for stronger legal protection of World Heritage Sites,” 2016, www.icmm.com/en-gb/news/2016/icmm-calls-for-protection-of-world-heritage-sites.
-
110
Abbi Buxton, People and nature first: safeguards needed in mining exploration (International Institute for Environment and Development, 2021) www.iied.org/20736iied.
-
111
See for example in Colombia: Lorenzo Cotula, Investment disputes from below: whose rights matter? (International Institute for Environment and Development, 2020), www.iied.org/investment-disputes-below-whose-rights-matter.
-
112
Nicola Woodroffe and Tim Grice, Beyond Revenues: Measuring and Valuing Environmental and Social Impacts in Extractive Sector Governance (Natural Resource Governance Institute, 2019), www.resourcegovernance.org/analysis-tools/publications/beyond-revenues-measuring-environmental-social-impacts.
-
113
IFC, E&S Performance Standards (2012), www.ifc.org/wps/wcm/connect/topics_ext_content/ifc_external_corporate_site/sustainability-at-ifc/policies-standards/performance-standards; IGF, Environmental and Social Impact Assessments (2020), www.igfmining.org/our-work/environmental-and-social-impact-assessments.
-
114
Daniel Whyte, “Forest finance: how Gabon earned the first payment for conservation in Africa,” Climate Tracker, 8 December 2021, www.climatetracker.org/forest-protection-first-payment-gabon-africa.
-
115
See for example Taako Edema George, Kiemo Karatu, and Andama Edward, “An evaluation of the environmental impact assessment practice in Uganda: challenges and opportunities for achieving sustainable development,” Heliyon 6(9), 2020, www.ncbi.nlm.nih.gov/pmc/articles/PMC7505666.
-
116
See for example Organisation for Economic Co-operation and Development, Guiding Principles for Durable Extractive Contracts (2019), www.oecd.org/dev/Guiding_Principles_for_durable_ extractive_contracts.pdf; United Nations Human Rights Office
of the High Commissioner, Principles for Responsible Contracts: Integrating the Management of Human Rights Risks into State-Investor Contract Negotiations- Guidance for Negotiators (2015), www.ohchr.org/%20Documents/Publications/Principles_ResponsibleContracts_HR_PUB_15_1_EN.pdf; and NRGI (2014). -
117
See for example Reuters, “South Africa’s Gold Fields bets on solar to cut costs and carbon,” 13 October 2022, www.reuters.com/business/sustainable-business/south-africas-gold-fields-bets-solar-cut-costs-carbon-2022-10-13.
-
118
U.N. Climate Change Conference UK 2021, “Glasgow Leaders’ Declaration on Forests and Land Use,” 2021, ukcop26.org/glasgow-leaders-declaration-on-forests-and-land-use.
-
119
Frances Seymour, Tony La Vina and Kristen Hite, Evidence linking community-level tenure and forest condition: An annotated bibliography (Climate and Land Use Alliance, 2015), www.climateandlandusealliance.org/wp-content/uploads/2015/08/Community_level_tenure_and_forest_condition_bibliography.pdf.
-
120
Peter G. Veit, “9 Facts about Community Land and Climate Mitigation” (World Resources Institute, 2021) files.wri.org/d8/s3fs-public/2021-10/9-facts-about-community-land-and-climate-mitigation.pdf.
-
121
Development Bank of Southern Africa, African Environmental Assessment Legislation Handbook: Consultation Draft, 2021, www.dbsa.org/african-environmental-assessment-legislation-handbook.
-
122
United Nations Development Programme, Participatory Environmental Monitoring Committees in Mining Contexts, 2019, www.undp.org/publications/participatory-environmental-monitoring-committees-mining-contexts.
-
123
Jonathan Watts, “Murders of environment and land defenders hit record high,” The Guardian, 13 September 2021, www.theguardian.com/environment/2021/sep/13/murders-environment-land-defenders-record-high.
-
124
NRGI (2017), “Resource Governance Index 2017.” There was a small improvement in a smaller sample of countries covered by the 2021 edition of the Resource Governance Institute.
-
125
With a gold price of USD 1,600 per ounce.
-
126
With a low-profit mine and a gold price of $1,600 per ounce.
-
127
Cecilia Jamasmie, “Petra Diamonds’ stake in Williamson to shrink as part of deal with Tanzania,” Mining.com, 13 December 2021, www.mining.com/petra-diamonds-stake-in-williamson-to-shrink-as-part-of-deal-with-tanzania.
-
128
Lifezone Metals, “Kabanga Nickel Signs Framework Agreement,” 19 January 2021, www.lifezonemetals.com/kabanga-nickel-signs-framework-agreement.
-
129
Thomas Scurfield and Silas Olan’g, “Magufuli Seeks the Right Balance for Tanzania’s Mining Fiscal Regime,” NRGI, 31 January 2019, www.resourcegovernance.org/blog/magufuli-seeks-right-balance-tanzania-mining-fiscal; Thomas Scurfield, “Tanzania Strikes a Better Balance with its Mining Fiscal Regime,” NRGI, 24 June 2020, www.resourcegovernance.org/blog/tanzania-strikes-better-balance-mining-fiscal-regime.
-
130
This framework agreement was published in a document setting out Barrick’s offer to buy the shares it did not already own in Acacia Mining, the previous owner of the Bulyanhulu, Buzwagi and North Mara mines in Tanzania. See Acacia Mining and Barrick Gold, Recommended Final Offer for Acacia Mining Plc by Barrick Gold Corporation, 2019, 66–79, s25.q4cdn.com/322814910/files/doc_downloads/acacia/Acacia-2.7-announcement.pdf.
-
131
The main revenue streams are import duty, skills development levy, royalty, corporate income tax, a share of dividends and shareholder loan repayments through state equity, and dividend withholding tax.
-
132
The earlier in time a shilling (Tanzania’s official currency unit) is received, the more it is worth. This is, first, because it can be used earlier; and second, because the future is uncertain, and no one can be sure they will receive that shilling in the future. To account for this time value of money, a “discount rate” is applied. In the sharing arrangement, this would mean that if the government received a shilling in year 1, the company would need to receive more than a shilling in year 2 for the benefits to be comparable. However, given cumulation here is based on actual cash flow, the company would need to receive only a shilling in year 2 for the benefits to be shared equally.
-
133
This provision for the company to earn its minimum return before sharing is triggered means Ecuador’s mechanism is similar to an R-based cash flow tax, commonly referred to as a Brown Tax. See, e.g., Robin Broadway and Michael Keen, “Theoretical perspectives on resource tax design,” in The Taxation of Petroleum and Minerals: Principles, Problems and Practice, edited by Philip Daniel, Michael Keen and Charles McPherson (Oxford: Routledge, 2010), 13–74.
-
134
Prices are taken from World Bank, “Commodities Price Data (The Pink Sheet),” www.worldbank.org/en/research/commodity-markets.
-
135
With a gold price of $1,600 per ounce.
-
136
With a gold price of $1,600 per ounce.
-
137
With a gold price of $1,600 per ounce.
-
138
The Fraser Institute survey estimates that, unless there are extremely harmful policies, around 60 percent of an investment decision tends to be based on a country’s geology. The other 40 percent comprises of several other factors, including political stability and policy predictability (given they affect the risk that investors will not be able to secure future returns generated by their investments), a conducive business environment and the tax level. See Julio Mejia and Elmira Aliakbari, Fraser Institute Annual Survey of Mining Companies 2022, (Fraser Institute, 2023), 8, www.fraserinstitute.org/studies/annual-survey-of-mining-companies-2022.
-
139
However, information gaps make it difficult for taxes to be structured to capture all excess profit. See Jean-Franҫois Wen, Progressive Taxation of Extractive Resources as Second-Best Optimal Policy (International Monetary Fund, 2018), www.imf.org/en/Publications/WP/Issues/2018/06/13/Progressive-Taxation-of-Extractive-Resources-as-Second-Best-Optimal-Policy-45923.
-
140
Recent research provides a sense of the potential revenue loss to governments from tax avoidance. The International Monetary Fund recently estimated that sub-Saharan African mining countries could be losing between $450 and $730 million in corporate income tax a year. See Sebastian Beer and Dan Devlin, Is There Money on the Table? Evidence on the Magnitude of Profit Shifting in the Extractive Industries (International Monetary Fund, 2021), www.imf.org/en/Publications/WP/Issues/2021/01/15/Is-There-Money-on-the-Table-Evidence-on-the-Magnitude-of-Profit-Shifting-in-the-Extractive-49983.
-
141
It is perhaps surprising that Tanzania’s 50-50 sharing arrangement generates an AETR greater than 50 percent (with a discount rate of 10 percent). This is despite AETR measuring government take as the share of pre-tax profits, which is larger than “economic benefits” (given economic benefits exclude interest payments). This outcome results from the 50-50 split being based on actual cash flow. The government receives revenue before the mining company through input and production taxes that do not depend on the mine making a profit. Because of these earlier revenues, the government receives a larger share on a discounted basis.
-
142
As reported in the S&P Global database. Legal risks are “expropriation, state contract alteration and contract enforcement risks.” Tax risks are “tax increase and tax inconsistency risks.” Control Risks scores these risks as still “very high” and “high” respectively (following Tanzania’s overhaul of extractives sector laws and other actions against existing mines in 2017) but reducing.
-
143
With a discount rate of 10 percent. While Ecuador’s sharing mechanism does not account for the labor profit share because none of it will go to the government from 2024 onwards, I have included it in the AETR because it is a tax on the project. The Democratic Republic of Congo regime has an excess profits tax that is triggered for a mine when the realized price is at least 25 percent higher than the price in its feasibility study. I assumed that the feasibility study has a price of $1,300 per ounce, so the excess profits tax is not triggered.
-
144
Total benefits in this case are a project’s revenues minus operating costs and replacement capital (but not minus exploration and development capital). This cash flow represents the money available to pay back the initial investment and provide a return. The government share of it is a common measure of progressivity.
-
145
Wen, Progressive Taxation of Extractive Resources as Second-Best Optimal Policy.
-
146
With a discount rate of 10 percent. The results for only some countries are shown to clearly depict each data point. The results for all the evaluated countries can be found in my model.
-
147
Scurfield, “Tanzania Strikes a Better Balance with its Mining Fiscal Regime.”
-
148
This feature is not fully reflected in Figure 5 given that “total benefits” use a slightly different definition of profits and are based on discounted cash flows.
-
149
With a gold price of $1,600 per ounce.
-
150
For example, an average 62 percent of respondents to the Fraser Institute surveys between 2017 and 2019 said the current implementation of Tanzania’s legal system would strongly discourage investment, and 73 percent said regulatory uncertainty would. See, e.g., Ashley Stedman, Jairo Yunis and Elmira Aliakbari, Fraser Institute Annual Survey of Mining Companies 2019 (Fraser Institute, 2020), www.fraserinstitute.org/studies/annual-survey-of-mining-companies-2019.
-
151
With a low-profit mine and a gold price of $1,600 per ounce.
-
152
Tax avoidance could extend the Philippines’ recovery period, and therefore delay the payment of some taxes including import duty and interest withholding tax, given the end of the recovery period depends on the reported profitability of a mine rather than an ex-ante assessment. However, the rule that the recovery period must end five years from the start of production regardless of whether pre-production expenses have been recouped limits the extent to which it can be extended.
-
153
The merits of these measures require further scrutiny. E.g., taking a share of loan repayments could result in lenders charging a higher interest rate to ensure they still recoup their loan and a minimum return. This would not only reduce taxable income but also make it harder for the government to assess whether an interest rate is reasonable, because it would not be comparable with industry benchmarks. It can also be difficult for a government to always determine whether a loan is from a related party or not. However, these considerations are outside the scope of this analysis.
-
154
Natural Resource Governance Institute (NRGI), Natural Resource Charter, 2nd edition, 2014, resourcegovernance.org/analysis-tools/publications/natural-resource-charter-2nd-ed.
-
155
Although its exclusion of several significant taxes from the government’s share of benefits means low-profit mines may still be impacted.
-
156
With a gold price of $1,600 per ounce.
-
157
Anna Fleming, Thomas Lassourd and David Manley, “Variable Royalties: an Answer to Volatile Mineral Prices?” in Handbook on the Future of Resource Taxation, African Tax Administration Forum and Intergovernmental Forum on Mining, Minerals, Metals and Sustainable Development (forthcoming), www.iisd.org/publications/brief/future-resource-taxation-roadmap.
-
158
Ensuring that interest rates used as a comparison apply to comparable assets with a similar risk profile is challenging, but rules of this nature have been successful in reducing profit shifting in other countries. See Beer and Devlin, Is There Money on the Table?.
-
159
The main taxes listed are VAT, royalty and corporate income tax. The regime also includes a share of pre-tax profits that is currently divided between the company’s workers and the government, with the portion received by the government included in its accumulated benefits. However, a recent court ruling means that all this labor profit share will go to workers from the start of 2024 and therefore none of it will be included in government benefits.
-
160
The discount rate used is specific to each mine and based on its weighted average cost of capital (WACC). I have assumed that WACC is around 7 percent in real terms. This is based on the typical discount rate for equity shareholders used by industry and government analysts of 8 percent in real terms, and the current average cost of debt for the mining sector as reported by Aswath Damodaran, Damodaran Online, www.pages.stern.nyu.edu/~adamodar.
-
161
Republic of the Philippines, Financial or Technical Assistance Agreement, mgb.gov.ph/attachments/article/79/PFC_FTAA.pdf.
-
162
For example, some terms in the original FTAA for an OceanaGold mine differed in some areas: Republic of the Philippines, Financial or Technical Assistance Agreement with Arimco Mining Corporation, 1994, www.resourcecontracts.org/contract/ocds-591adf-2792396017. I understand that the recently signed extension to this agreement has slightly different terms again.
-
163
A template of the FARI model and a user guide that explains all the concepts and workings of the model are available at International Monetary Fund, “Fiscal Analysis of Resource Industries,”www.imf.org/external/np/fad/fari.
The Future of Mining Taxation
Webinar

This webinar delved into how countries can adapt their mining tax policies to respond to climate change, automation, and the global tax justice movement. The event also explored the risks and opportunities these trends present for the mining sector.
Key discussion questions included:
- Are current financial benefit-sharing mechanisms (royalties and corporate income tax) fit for purpose?
- How can resource-rich countries adapt their mining tax regimes to seize opportunities and manage risks facing the sector?
- How can global tax cooperation include the mining sector (if at all)?
- How can tax policies help the mining sector to combat climate change?
Speakers included:
- Anthony Bebbington, Ford Foundation (moderator)
- William Davis, NRGI
- Mukupa Nsenduluka, Tax Justice Network – Africa
- Viola Tarus, IGF
The event is targeted primarily at civil society actors, predominantly from Africa and Latin America. Government officials are also welcome.

Notes
-
1
International Energy Agency, The Role of Critical Minerals in Clean Energy Transitions (2021), www.iea.org/reports/the-role-of-critical-minerals-in-clean-energy-transitions.
-
2
In this report we refer to both Africa north and south of the Sahara. When we mean one of the sub-regions we specify as such.
-
3
IEA (2021); Clyde Russell, “Mining is key to energy transition, but it’s still unloved,” Reuters, 11 May 2022, www.reuters.com/business/energy/mining-is-key-energy-transition-its-still-unloved-russell-2022-05-11; Jairo Yunis and Elmira Aliakbari, Annual Survey of Mining Companies 2020 (Fraser Institute, 2021), www.fraserinstitute. org/studies/annual-survey-of-mining-companies-2020.
-
4
See, for example, Natural Resource Governance Institute, Natural Resource Charter 2nd edition (2014), resourcegovernance.org/approach/natural-resource-charter.
-
5
Natural Resource Governance Institute, Resource Governance Index: From Legal Reform to Implementation in Sub-Saharan Africa (2018), resourcegovernance.org/sites/default/files/documents/rgi-from-legal-reform-to-implementation-sub-saharan-africa.pdf.
-
6
Africa Climate Foundation, Geopolitics of Critical Minerals in Renewable Energy Supply Chains (2022), africanclimatefoundation.org/news_and_analysis/geopolitics-of-critical-minerals-in-renewable-energy-supply-chains/.
-
7
See for example, Cooper Inveen, “Atlantic Lithium’s Ghana mine poised to being production by 2024,” Reuters, 20 September 2022, www.reuters.com/article/ghana-mining-lithium/atlantic-lithiums-ghana-mine-poised-to-begin-production-by-2024-idUSKBN2QV0NQ?utm_source=substack&utm_me….
-
8
As demonstrated by recent discussions between a U.S.-led group of rich countries and mineral producers such as the Democratic Republic of Congo, Namibia and Tanzania. Julian Pecquet, “US looks to Africa to
diversify supply chain for critical minerals,” The Africa Report, 23 September 2022. www.theafricareport.com/243847/us-looks-to-africa-to-diversify-supply-chain-for-critical-minerals. -
9
Glada Llahn and Paul Stevens, The curse of the one-size-fits-all fix, UNU-WIDER Working Paper (United Nations University, 2017), www.wider.unu.edu/sites/default/files/wp2017-21.pdf. For further assessment of donors’ activities in the past, both positive and negative lessons, see: Joanna Buckley, Neil McCulloch and Nick Travis, Donor-supported approaches to improving extractives governance, UNU-WIDER Working Paper (United Nations University, 2017), www.wider.unu.edu/sites/default/files/wp2017-33.pdf; Siân Herbert and Laura Bolton, Donor activity in the extractives sector (Knowledge, evidence and learning for development, 2018), opendocs.ids.ac.uk/opendocs/bitstream/handle/20.500.12413/13589/Donor_activity_in_the_extractives_sector.pdf.
-
10
Although this estimate includes emissions resulting from the investments by each group. Lucas Chancel, “Global carbon inequality over 1990–2019,” Nature Sustainability (2022), doi. org/10.1038/s41893-022-00955-z.
-
11
For Further reading on this dilemma and the arguments between the proponents of “green growth” and “degrowth, see: Alex Bowen and Samuel Fankhauser, “The Green Growth Narrative: Paradigm Shift or Just Spin? Global Environmental Change-human and Policy Dimensions,” Global Environmental Change, 21 (2021), 1157-1159, DOI: I:10.1016/j. gloenvcha.2011.07.007; Kate Raworth, Doughnut Economics: Seven Ways to Think Like a 21st Century Economist, Random House Business Books, London, 2017; Jason Hickel, “What does degrowth mean? A few points of clarification,” Globalizations, 18:7 (2021), 1105-1111, DOI: 10.1080/14747731.2020.1812222.
-
12
McKinsey & Company, “The raw-materials challenges: How the metals and mining sector will be at the core of enabling the energy transition” (2022), www.mckinsey. com/industries/metals-and-mining/our-insights/the-raw-materials-challenge-how-the-metals-and-mining-sector-will-be-at-the-core-of-enabling-the-energy-transition.
-
13
McKinsey & Company, “Metal mining constraints on the electric mobility horizon” (2018), www.mckinsey.com/industries/oil-and-gas/our-insights/metal-mining-constraints-on-the-electric-mobility-horizon.
-
14
McKinsey (2018)
-
15
NRGI analysis, based on Net Zero Tracker. “Net Zero Tracker,” Energy and Climate Intelligence Unit, Data-Driven EnviroLab, NewClimate Institute, Oxford Net Zero (2022), zerotracker.net
-
16
Pratima Desai, “Low carbon world needs $1.7 trillion in mining investment,” Reuters, 10 May 2021, www.reuters.com/business/energy/low-carbon-world-needs-17-trillion-mining-investment-2021-05-10/
-
17
Based on S&P Global Market Intelligence data and U.S. Geological Survey, Mineral Commodity Summaries 2022, 2022, www.pubs.er.usgs.gov/publication/mcs2022. These sources sometimes differ significantly. An average is taken when the reported amounts are similar. When they are not, a third source is used to determine which is likely to be more accurate.
-
18
NRGI analysis based on reserves reported in the S&P Globaldatabase and U.S. Geological Survey (2022), and the mineral volumes in a standard electric vehicle in IEA (2021).
-
19
See for example, World Bank, “New World Bank Survey Brings Hope to Malawi’s Mineral Potential,” 22 September 2015, www.worldbank.org/en/news/feature/2015/09/22/new-world-bank-survey-brings-hope-to-malawis-mineral-potential.
-
20
International Energy Agency, Global Supply Chains of EV Batteries (2022), www.iea.org/reports/global-supply-chains-of-ev-batteries.
-
21
African Minerals Development Centre (AMDC), “Unveiled: The #AMDC’s Theory of Change: A prosperous and transformed Africa achieved through sustainable development of mineral and energy resources...” Twitter post (11 October 2022), www.twitter.com/AfricanAmdc/status/1579789353584164864.
-
22
Based on S&P Global data and U.S. Geological Survey (2022). These sources sometimes differ significantly. An average is taken when the reported amounts are similar. When they are not, a third source is used to determine which is likely to be more accurate.
-
23
The correlation between exploration and mineral reserves per square kilometer is 0.79. The figure compares exploration for all metals except gold from 2002 to 2021 with current value of transition mineral reserves. Exploration spend, reserves and prices from S&P Global Market Intelligence; land area data from www.worldpopulationreview.com.
-
24
The correlation between the Resource Governance Index and Policy Potential Index scores is 0.5. The NRGI Resource Governance Index measures the transparency and accountability of mining institutions. The Policy Potential Index (PPI) in the Fraser Institute survey shows the attractiveness of a country’s policies to investors. The PPI score reported in the figure is an average of the scores from 2017 to 2021 where available, and average across jurisdictions for countries that have several. Some countries have low survey response rates, between 5 to 9 respondents. Natural Resource Governance Institute, “Resource Governance Index 2017,” 2017, resourcegovernanceindex.org; Yunis and Aliakbari (2021).
-
25
African Minerals Development Centre, Desktop Review of African Geological Survey Organisation Capacities and Gaps (United Nations Economic Commission for Africa, 2018), archive.uneca.org/publications/desktop-review-african-geological-survey-organisation-capacities-and-gaps.
-
26
Antony Sguazzin, “South Africa Sets 900 Million Annual Mineral Exploration Target,” Bloomberg, 12 April 2022, www.bloomberg.com/news/articles/2022-04-12/s-africa-sets-900-million-annual-mineral-exploration-target.
-
27
Oil exploration investment is known to correlated strongly with the quality of governance in a country, and it seems likely that a similar pattern holds for mineral exploration. See James Cust and Harding Torfinn, “Institutions and the Location of Oil Exploration”, Journal of the European Economic Association (2019).
-
28
Richard Schodde, “Key issues affecting the time delay between discovery and development – is it getting harder and longer?” PDAC 2014, 3 March 2014, Toronto. minexconsulting.com/wp-content/uploads/2019/04/Schodde-presentation-to-PDAC-March-2014.pdf
-
29
Summary of five studies. The outlier is the McKinsey study (7 to 10 years), but this was based on “large-scale greenfield assets” only. Like findings of Schodde (2021), which highlights that large projects are quicker. McKinsey (2022); IEA (2021); Tehmina Khan, Trang Nguyen, Franziska Ohnsorge, and Richard Schodde, “From Commodity Discovery to Production,” Policy Research Working Paper (World Bank, 2016); Paul Manalo, “Top mines average time from discovery to production: 16.9 years,” Metals and Mining Research S&P Global Market Intelligence (2020); Schodde (2014).
-
30
IEA (2021)
-
31
Schodde (2021) and Khan et al. (2016)
-
32
David Humphreys, “The mining industry and the supply of critical minerals,” Critical Minerals Handbook, Gus Gunn (ed.), chapter 2, 2013.
-
33
Khan et al. (2016)
-
34
Several of the experts interviewed for this report suggested that this is the main opportunity for shortening lead times.
-
35
David Manley, Patrick R.P. Heller and William Davis, No Time to Waste: Governing Cobalt Amid the Energy Transition (Natural Resource Governance Institute, 2022), resourcegovernance.org/no-time-to-waste-governing-cobalt-amid-energy-transition.
-
36
Matt Renaud and Mustafa Kumral, “Out of the Comfort Zone: Quantifying Country Risk for Foreign Mining Project Investment Feasibilities,” Mining, Metallurgy & Exploration, 38, 2323-2335 (2021), www.doi.org/10.1007/s42461-021-00495-8.
-
37
Based on S&P Global data and U.S. Geological Survey (2022). These sources sometimes differ significantly. An average is taken when the reported amounts are similar. When they are not, a third source is used to determine which is likely to be more accurate.
-
38
Henry Sanderson, “Vedanta starts arbitration against Zambia after mines seized,“ Financial Times, 31 May 2019. www.ft.com/content/98b0c464-83a1-11e9-b592-5fe435b57a3b.
-
39
Julia Tilley, “Labour talks 217: Escondida and other stories,” S&P Global Market Intelligence, Metals and Mining Research, 23 February 2017.
-
40
Keval Dhokia, “Global copper pipeline challenged due to disruption,” S&P Global Market Intelligence, Metals and Mining Research, 18 June 2019.
-
41
Sudarshan Varadhan, “Indian state seeks permanent closure of Vedanta’s copper smelter: officials,” Reuters, 24 May 2018. www.reuters.com/article/us-vedanta-smelter-idUSKCN1IP1CX.
-
42
Dhokia (2019)
-
43
Misha Savic, Jan Bratanic and Thomas Biesheuvel, “Europe’s Biggest Lithium Mine Blocked as Rio Loses in Serbia,” Bloomberg, 20 January 2022, www.bloomberg.com/news/articles/2022-01-20/serbia-suspends-rio-tinto-s-2-4-billion-lithium-mine-project.
-
44
Tanzania Minerals Audit Agency, A Study on Viability to Construct a Copper Concentrate Smelter in Tanzania (2011), www.scribd.com/document/193187016/A-Study-on-Viability-to-Construct-a-Copper-Concentrate-Smelter-in-Tanzania1.
-
45
Africa Confidential, “Local processing row holds up rare earth mine,” 25 October 2022, www.africa-confidential.com/article-preview/id/14166/Local_processing_row_holds_up_rare_earth_mine.
-
46
Reuters, “Timeline: The battle for Simandou,” 22 January 2021, www.reuters.com/article/us-swiss-steinmetz-timeline-idUSKBN29R2AA.
-
47
Magnus Ericsson and Olof Löf, “Mining’s contribution to national economies between 1996 and 2016,” Mineral Economics, 223–250 (2019), doi.org/10.1007/s13563-019-00191-6.
-
48
Net savings plus education expenditure and minus energy depletion, mineral depletion, net forest depletion, and carbon dioxide and particulate emissions damage. NRGI analysis of World Bank, “World Development Indicators,” accessed 28 September 2022, www.databank.worldbank.org/source/world-development-indicators.
-
49
Anthony J. Venables, “Using Natural Resources for Development: Why Has It Proven So Difficult?” Journal of Economic Perspectives, 30:1, 161–184 (2016) doi. org/10.1257/jep.30.1.161.
-
50
Giorgia Albertin, Boriana Yontcheva, Dan Devlin, Hilary Devine, Marc Gerard, Sebastian Beer, Irena Jankulov Suljagic and Vimal V. Thakoor, Tax Avoidance in Sub-Saharan Africa’s Mining Sector, Departmental Paper No 2021/022 (International Monetary Fund, 2021), www.imf.org/en/Publications/Departmental-Papers-Policy-Papers/Issues/2021/09/27/Tax-Avoidance-in-Sub-Saharan-Africas-Mining-Sector-464850
-
51
See for example, South African Human Rights Commission, National Hearing on the Underlying Socio-economic Challenges of Mining-affected Communities in South Africa (2016), www.sahrc.org.za/home/21/files/SAHRC%20Mining%20communities%20report%20FINAL.pdf
-
52
See, for example, Claude Kabemba, “How mineral resources can fuel the development of Africa in the context of post-Covid economic recovery,” Publish What You Pay Annual Conference, 14-15 March 2021, www.sarwatch.co.za/how-mineral-resources-can-fuel-the-development-of-africa-in-the-context-of-post-covid-economic-recovery.
-
53
See, for example, African Development Bank, Request for Expressions of Interest, 2022, www.afdb.org/sites/default/files/reoi_green_minerals_strategy_approach_paper_002.pdf.
-
54
Other partners currently include African Legal Support Facility, Africa Finance Corporation, Afreximbank, United Nations Economic Commission for Africa and United Nations Development Programme.
-
55
African Development Bank, “Why Africa is the next renewables powerhouse,” 7 December 2018, www.afdb.org/en/news-and-events/why-africa-is-the-next-renewables-powerhouse-18822
-
56
Manley et al (2022)
-
57
Through Power Africa (www.usaid.gov/powerafrica), for example.
-
58
Reserves data is from S&P Global Market Intelligence and U.S. Geological Survey. The above ground assets of a country comprise its power and transport infrastructure, human capital and other productive capabilities, level of environmental protection and investment climate. They have been converted to a regional index of 0-100.
The data is from multiple sources: African Development Bank, The Africa Infrastructure Development Index (AIDI) 2020, 2020, www.afdb.org/en/documents/economic-brief-africa-infrastructure-development-index-aidi-2020-july-2020; World Bank, “World Development Indicators”; African Development Bank, Electricity Regulatory Index (ERI) for Africa, 2021, 2021, africa-energy-portal.org/reports/electricity-regulatory-index-eri-africa-2021-edition; World Intellectual Property Organization, Global Innovation Index (GII) 2021, 2021, www.wipo.int/publications/en/details.jsp?id=4560; Harvard Growth Lab, “The Atlas of Economic Complexity,” accessed 20 September 2022, www.atlas.cid.harvard.edu/; Environmental Protection Index, “2022 Environmental Protection Index (2022),” accessed 20 September 2022, www.epi.yale.edu/; World Bank, “Doing Business 2020,” accessed 20 September 2022, www.worldbank.org/en/programs/business-enabling-environment/doing-business-legacy; S&P Global, “Control Risks Country Risk Summary,” accessed 20 September 2022, www.capitaliq.spglobal.com. -
59
Southern African Development Community and African Minerals Development Centre, Developing a Regional Mining Vision for the Southern African Development Community (SADC), 2018.
-
60
Manley et al (2022)
-
61
Emily Hersh, Alex Grant and Chris Berry, So, You Want to make Batteries Too? (Payne Institute, 2020), www.payneinstitute.mines.edu/so-you-want-to-make-batteries-better-too
-
62
Ibid.
-
63
See for example, African Development Bank, Lithium-Cobalt Value Chain Analysis for Mineral Based Industrialization in Africa (2021), www.afdb.org/en/documents/lithium-cobalt-value-chain-analysis-mineral-based-industrialization-Africa.
-
64
McKinsey & Company, Power to move: Accelerating the electric transport transition in sub-Saharan Africa (2022), www.mckinsey.com/industries/automotive-and-assembly/our-insights/power-to-move-accelerating-the-electric-transport-transition-in-sub- aharan-africa.
-
65
BloombergNEF, The Cost of Producing Battery Precursors in the DRC (2021), about. bnef.com/blog/producing-battery-materials-in-the-drc-could-lower-supply-chain-emissions-and-add-value-to-the-countrys-cobalt.
-
66
Mohua Mukherjee, India’s Mass-Market Clean Mobility Initiatives and its Unique, Customized Business Models for Light Electric Vehicles (The Oxford Institute for Energy Studies, 2022), www.oxfordenergy.org/publications/indias-mass-market-clean-mobility-initiatives-and-its-unique-customized-business-models-for-light-electric-vehicles.
-
67
Rwanda Ministry of Infrastructure, Strategic Paper on Electric Mobility Adaption in Rwanda (2021), www.mininfra.gov.rw/fileadmin/user_upload/Mininfra/Publications/Laws_Orders_and_Instructions/Transport/16062021_Strategic_Paper_for_e-mobility_adapta….
-
68
Manley et al (2022)
-
69
IEA (2022)
-
70
See for example World Gold Council, Responsible gold mining and value distribution, 2013 report (2013), www.gold.org/goldhub/research/responsible-gold-mining-and-value-distribution-2013-report.
-
71
World Gold Council (2013). Mining Shared Value has indicated these figures are representative of wider sector trends.
-
72
Jeff Geipel, Mining Shared Value, interview with authors, 25 September 2022.
-
73
Government of Canada, “Minerals Sector Employment,” January 2019, www.nrcan.gc.ca/science-data/science-research/earth-sciences/earth-sciences-resources/earth-sciences-federal-programs/minerals-sector-employment/16739; Mets Ignited, “METS in Australia,” accessed 28 September 2022, www.metsignited.org/australian-mets-sector/.
-
74
Aaron Cosbey and Isabelle Ramdoo, Guidance for Governments: Local Content Policies (Intergovernmental Forum on Mining, Minerals, Metals and Sustainable Development, 2018), igf-guidance-for-governments-local-content.pdf; International Finance Corporation, Guide to Getting Started in Local Procurement (2011), www.ifc.org/wps/wcm/connect/topics_ext_content/ifc_external_corporate_site/sustainability-at-ifc/publications/publications_handbook_guidetogettingsta…; Mining Shared Value and Engineers Without Borders, The Mining Local Procurement Reporting Mechanism (LPRM) (2017), www.miningsharedvalue.org/mininglprm.
-
75
See for example, activities of the Industrial Development Corporation (www.idc.co.za) and Anglo American’s Zimele programs (www.southafrica.angloamerican.com/our-difference/zimele)
-
76
Southern Africa Resource Watch, From Harmonisation of Policies to the Manufacturing of Lithium Batteries in Southern Africa: Collaboration between DRC and Zambia (2022), www.sarwatch.co.za/publication/from-harmonisation-of-policies-to-the-manufacturing-of-lithium-batteries-in-southern-africa-collaboration-between-drc-….
-
77
Jeff Geipel, Mining Shared Value, interview with authors, 25 September 2022.
-
78
Giorgia Albertin et al (2021). Note that the definition of mineral-dependent does not overlap with which countries have substantial reserves of transition minerals.
-
79
Ibid. The IMF estimates the 15 mineral-rich countries earned mining revenues equals 2 percent of GDP on average. This amounts to $13 billion a year.
-
80
For example, if companies were to adhere to more responsible tax practices such as the B Team Responsible Tax Principles. See The B Team, “Advancing Responsible Tax Practice,” accessed 28 September 2022, www.bteam.org/our-work/causes/governance/advancing-responsible-tax-practice.
-
81
Yannick Bouterige, Céline de Quatrebarbes and Bertrand Laporte, Mining Taxation in Africa: What Evolution in 2018? (International Centre for Tax and Development, 2020), www.ictd.ac/publication/mining-taxation-africa-recent-evolution.
-
82
Giorgia Albertin et al (2021).
-
83
For example, a study of contracts on resourcecontracts.org revealed that Burkina Faso, Burundi, Guinea, Madagascar and Mali had agreed stabilization clauses lasting 30- 34 years on average—significantly longer than necessary to ensure the bankability of projects. Intergovernmental Forum on Mining, Minerals, Metals and Sustainable Development, Insights on Incentives: Tax Competition in Mining (2019), www.iisd.org/sites/default/files/publications/insights-incentives-tax-competition-mining.pdf; Natural Resource Governance Institute, resourcecontracts.org.
-
84
NRGI analysis using S&P Global mineral reserves and price data. Prices are near-term forecasts and therefore may be elevated compared to the longer-term trend.
-
85
NRGI analysis. On average, 16 percent of mining sales revenue has gone to tax payments. See Robert Pitman and Kaisa Toroskainen, Beneath the surface: The Case for Oversight of Extractive Industry Suppliers (Natural Resource Governance Institute, 2020) resourcegovernance.org/analysis-tools/publications/beneath-surface-oversight-extractive-industry-suppliers.
This figure aligns with estimates in other studies: Olle Östensson, Local content, supply chains, and shared infrastructure, UNU-WIDER Working Paper (United Nations University, 2017), www.researchgate.net/publication/337699966_Local_content_supply_chains_and_shared_infrastructure; Price Waterhouse Coopers, Total Tax Contribution: A study of the economic contribution mining companies make to public finances (2010), www.pwc.co.uk/assets/pdf/ttc-mining-study-1.pdf. -
86
Anthony J. Venables (2016) and Natural Resource Governance Institute (2014).
-
87
NRGI (2017), “Resource Governance Index 2017.” There was a small improvement in a smaller sample of countries covered by the 2021 edition of the Resource Governance Institute.
-
88
Anna Fleming, Thomas Lassourd and David Manley, “Variable Royalties: an Answer to Volatile Mineral Prices?” in Handbook on the Future of Resource Taxation, African Tax Administration Forum and Intergovernmental Forum on Mining, Minerals, Metals and Sustainable Development (forthcoming),www.iisd.org/publications/brief/future-resource-taxation-roadmap.
-
89
Robert Pitman, “Contract Disclosure Policy and Practice Tracker,” accessed 15 October 2022, docs.google.com/spreadsheets/d/1FXEeD43jw6VYHV8yS-8KJ5-rR5l0XtKxVQZBWzr-ohY.
-
90
Based on membership of the Extractive Industries Transparency Initiative (www.eiti.org/countries).
-
91
Natural Resource Governance Institute, “Chile country profile,” accessed 5 October 2022, www.resourcegovernanceindex.org/country-profiles/CHL/mining.
-
92
Transparency International, “Corruption Perceptions Index 2021,” www.transparency.org/en/cpi/2021.
-
93
United Nations Office on Drugs and Crime, Corruption and Sustainable Development (no date), www.anticorruptionday.org/documents/actagainstcorruption/print/corr18_fs_DEVELOPMENT_en.pdf
-
94
K.C. Michaels, Louis Maréchal and Benjamin Katz, “Why is ESG so important to critical mineral supplies, and what can we do about it?” (International Energy Agency, 2022) www.iea.org/commentaries/why-is-esg-so-important-to-critical-mineral-supplies-and-what-can-we-do-about-it
-
95
Extractive Industries Transparency Initiative, Making the grade: Strengthening governance of critical minerals, www.eiti.org/documents/strengthening-governance-critical-minerals.
-
96
Extractive Industries Transparency Initiative, EITI Standard 2019, eiti.org/collections/ eiti-standard#EITI-Requirements-2019; Organisation for Economic Co-operation and Development, OECD Due Diligence Guidance for Responsible Supply Chains of Minerals from Conflict-Affected and High-Risk Areas (2016), www.oecd.org/daf/inv/mne/OECD-Due-Diligence-Guidance-Minerals-Edition3.pdf; Alexandra Gillies, Sebastian Sahla, Matthieu Salomon and Tom Shipley, Diagnosing Corruption in the Extractive Sector: A Tool for Research and Action (Natural Resource Governance Institute, 2021) www.resourcegovernance.org/analysis-tools/publications/diagnosing-corruption-extractive-sector-tool-research-and-actionrespectively.
-
97
Colombia National Mining Agency, Management and Corruption Risk Matrices of the ANM approved by the Institutional Management
and Performance Committee on 01/27/2022 (2022), www.anm.gov.co/?q=documentos_para_comentarios_ciudadania; Robert Pitman and Kaisa Toroskainen, “BHP, Others Increase Scrutiny of Subcontracting Corruption Risks” (Natural Resource Governance Institute, 2018) www.resourcegovernance.org/blog/bhp-others-increase-scrutiny-subcontracting-corruption-risks. -
98
Alexandra Gillies, “Will Extractive Companies Move Away from Corruption- Prone Intermediaries?”, (Natural Resource Governance Institute, 2019) www.resourcegovernance.org/blog/extractive-companies-corruption-intermediaries-middlemen-oil.
-
99
Natural Resource Governance Institute, Anticorruption Guidance for Partners of State-Owned Enterprises (2022), soe-anticorruption.resourcegovernance.org/chapters/avoiding-high-risk-agents
-
100
Favour Ime and Louise Russell-Prywata, “Beneficial ownership transparency and the fight against grand corruption in Nigeria” (Open Ownership, 2022), www.openownership.org/en/blog/beneficial-ownership-transparency-and-the-fight-against-grand-corruption-in-nigeria.
-
101
Nqobile Dludla, “South Africa mine dam wall collapses, Killing 1 and injuring 40,” Reuters, 11 September 2022, www.reuters.com/world/africa/south-africa-mine-dam-wall-collapses-killing-three-injuring-40-2022-09-11.
-
102
Kirsten Hund and Erik Reed, “A low-carbon future must protect the world’s forests” (World Bank, 2019), www.blogs.worldbank.org/voices/low-carbon-future-must-protect-worlds-forests.
-
103
NRGIcalculationsusingscope1,2and3 emissions (excluding fugitive methane and emissions from the combustion of coal) reported by Lindsay Delevingne, Will Glazener, Liesbet Grégoir and Kimberly Henderson, “Climate risk and decarbonisation: What every mining CEO needs to know,” McKinsey & Company, 2020 www.mckinsey.com/business-functions/sustainability/our-insights/climate-risk-and-decarbonization-what-every-mining-ceo-needs-to-know. Total global emissions are for 2019 from Climate Watch, “Global Historical Emissions,” accessed 18 September 2022, www.climatewatchdata.org/ghg-emissions?end_year=2019&start_year=1990.
-
104
See for example, Éléonore Lèbre, Martin Stringer, Kamila Svobodova, John R. Owen, Deanna Kemp, Claire Côte, Andrea Arratia-Solar and Rick K. Valenta, “The social and environmental complexities of extracting energy transition metals,” Nature Communications, 11: 4823 (2020), www.nature.com/articles/s41467-020-18661-9#MOESM1.
-
105
IEA (2021)
-
106
Ibid.
-
107
World Bank, “Climate Change Knowledge Portal,” accessed 28 September 2022, www.climateknowledgeportal.worldbank.org.
-
108
NRGI (2017)
-
109
Cameroon is one exception, with its new cadastre system preventing licenses being granted that overlap protected areas. Several companies also have a no-go policy, though only for World Heritage sites. See for example ICMM, “ICMM calls for stronger legal protection of World Heritage Sites,” 2016, www.icmm.com/en-gb/news/2016/icmm-calls-for-protection-of-world-heritage-sites.
-
110
Abbi Buxton, People and nature first: safeguards needed in mining exploration (International Institute for Environment and Development, 2021) www.iied.org/20736iied.
-
111
See for example in Colombia: Lorenzo Cotula, Investment disputes from below: whose rights matter? (International Institute for Environment and Development, 2020), www.iied.org/investment-disputes-below-whose-rights-matter.
-
112
Nicola Woodroffe and Tim Grice, Beyond Revenues: Measuring and Valuing Environmental and Social Impacts in Extractive Sector Governance (Natural Resource Governance Institute, 2019), www.resourcegovernance.org/analysis-tools/publications/beyond-revenues-measuring-environmental-social-impacts.
-
113
IFC, E&S Performance Standards (2012), www.ifc.org/wps/wcm/connect/topics_ext_content/ifc_external_corporate_site/sustainability-at-ifc/policies-standards/performance-standards; IGF, Environmental and Social Impact Assessments (2020), www.igfmining.org/our-work/environmental-and-social-impact-assessments.
-
114
Daniel Whyte, “Forest finance: how Gabon earned the first payment for conservation in Africa,” Climate Tracker, 8 December 2021, www.climatetracker.org/forest-protection-first-payment-gabon-africa.
-
115
See for example Taako Edema George, Kiemo Karatu, and Andama Edward, “An evaluation of the environmental impact assessment practice in Uganda: challenges and opportunities for achieving sustainable development,” Heliyon 6(9), 2020, www.ncbi.nlm.nih.gov/pmc/articles/PMC7505666.
-
116
See for example Organisation for Economic Co-operation and Development, Guiding Principles for Durable Extractive Contracts (2019), www.oecd.org/dev/Guiding_Principles_for_durable_ extractive_contracts.pdf; United Nations Human Rights Office
of the High Commissioner, Principles for Responsible Contracts: Integrating the Management of Human Rights Risks into State-Investor Contract Negotiations- Guidance for Negotiators (2015), www.ohchr.org/%20Documents/Publications/Principles_ResponsibleContracts_HR_PUB_15_1_EN.pdf; and NRGI (2014). -
117
See for example Reuters, “South Africa’s Gold Fields bets on solar to cut costs and carbon,” 13 October 2022, www.reuters.com/business/sustainable-business/south-africas-gold-fields-bets-solar-cut-costs-carbon-2022-10-13.
-
118
U.N. Climate Change Conference UK 2021, “Glasgow Leaders’ Declaration on Forests and Land Use,” 2021, ukcop26.org/glasgow-leaders-declaration-on-forests-and-land-use.
-
119
Frances Seymour, Tony La Vina and Kristen Hite, Evidence linking community-level tenure and forest condition: An annotated bibliography (Climate and Land Use Alliance, 2015), www.climateandlandusealliance.org/wp-content/uploads/2015/08/Community_level_tenure_and_forest_condition_bibliography.pdf.
-
120
Peter G. Veit, “9 Facts about Community Land and Climate Mitigation” (World Resources Institute, 2021) files.wri.org/d8/s3fs-public/2021-10/9-facts-about-community-land-and-climate-mitigation.pdf.
-
121
Development Bank of Southern Africa, African Environmental Assessment Legislation Handbook: Consultation Draft, 2021, www.dbsa.org/african-environmental-assessment-legislation-handbook.
-
122
United Nations Development Programme, Participatory Environmental Monitoring Committees in Mining Contexts, 2019, www.undp.org/publications/participatory-environmental-monitoring-committees-mining-contexts.
-
123
Jonathan Watts, “Murders of environment and land defenders hit record high,” The Guardian, 13 September 2021, www.theguardian.com/environment/2021/sep/13/murders-environment-land-defenders-record-high.
-
124
NRGI (2017), “Resource Governance Index 2017.” There was a small improvement in a smaller sample of countries covered by the 2021 edition of the Resource Governance Institute.
-
125
With a gold price of USD 1,600 per ounce.
-
126
With a low-profit mine and a gold price of $1,600 per ounce.
-
127
Cecilia Jamasmie, “Petra Diamonds’ stake in Williamson to shrink as part of deal with Tanzania,” Mining.com, 13 December 2021, www.mining.com/petra-diamonds-stake-in-williamson-to-shrink-as-part-of-deal-with-tanzania.
-
128
Lifezone Metals, “Kabanga Nickel Signs Framework Agreement,” 19 January 2021, www.lifezonemetals.com/kabanga-nickel-signs-framework-agreement.
-
129
Thomas Scurfield and Silas Olan’g, “Magufuli Seeks the Right Balance for Tanzania’s Mining Fiscal Regime,” NRGI, 31 January 2019, www.resourcegovernance.org/blog/magufuli-seeks-right-balance-tanzania-mining-fiscal; Thomas Scurfield, “Tanzania Strikes a Better Balance with its Mining Fiscal Regime,” NRGI, 24 June 2020, www.resourcegovernance.org/blog/tanzania-strikes-better-balance-mining-fiscal-regime.
-
130
This framework agreement was published in a document setting out Barrick’s offer to buy the shares it did not already own in Acacia Mining, the previous owner of the Bulyanhulu, Buzwagi and North Mara mines in Tanzania. See Acacia Mining and Barrick Gold, Recommended Final Offer for Acacia Mining Plc by Barrick Gold Corporation, 2019, 66–79, s25.q4cdn.com/322814910/files/doc_downloads/acacia/Acacia-2.7-announcement.pdf.
-
131
The main revenue streams are import duty, skills development levy, royalty, corporate income tax, a share of dividends and shareholder loan repayments through state equity, and dividend withholding tax.
-
132
The earlier in time a shilling (Tanzania’s official currency unit) is received, the more it is worth. This is, first, because it can be used earlier; and second, because the future is uncertain, and no one can be sure they will receive that shilling in the future. To account for this time value of money, a “discount rate” is applied. In the sharing arrangement, this would mean that if the government received a shilling in year 1, the company would need to receive more than a shilling in year 2 for the benefits to be comparable. However, given cumulation here is based on actual cash flow, the company would need to receive only a shilling in year 2 for the benefits to be shared equally.
-
133
This provision for the company to earn its minimum return before sharing is triggered means Ecuador’s mechanism is similar to an R-based cash flow tax, commonly referred to as a Brown Tax. See, e.g., Robin Broadway and Michael Keen, “Theoretical perspectives on resource tax design,” in The Taxation of Petroleum and Minerals: Principles, Problems and Practice, edited by Philip Daniel, Michael Keen and Charles McPherson (Oxford: Routledge, 2010), 13–74.
-
134
Prices are taken from World Bank, “Commodities Price Data (The Pink Sheet),” www.worldbank.org/en/research/commodity-markets.
-
135
With a gold price of $1,600 per ounce.
-
136
With a gold price of $1,600 per ounce.
-
137
With a gold price of $1,600 per ounce.
-
138
The Fraser Institute survey estimates that, unless there are extremely harmful policies, around 60 percent of an investment decision tends to be based on a country’s geology. The other 40 percent comprises of several other factors, including political stability and policy predictability (given they affect the risk that investors will not be able to secure future returns generated by their investments), a conducive business environment and the tax level. See Julio Mejia and Elmira Aliakbari, Fraser Institute Annual Survey of Mining Companies 2022, (Fraser Institute, 2023), 8, www.fraserinstitute.org/studies/annual-survey-of-mining-companies-2022.
-
139
However, information gaps make it difficult for taxes to be structured to capture all excess profit. See Jean-Franҫois Wen, Progressive Taxation of Extractive Resources as Second-Best Optimal Policy (International Monetary Fund, 2018), www.imf.org/en/Publications/WP/Issues/2018/06/13/Progressive-Taxation-of-Extractive-Resources-as-Second-Best-Optimal-Policy-45923.
-
140
Recent research provides a sense of the potential revenue loss to governments from tax avoidance. The International Monetary Fund recently estimated that sub-Saharan African mining countries could be losing between $450 and $730 million in corporate income tax a year. See Sebastian Beer and Dan Devlin, Is There Money on the Table? Evidence on the Magnitude of Profit Shifting in the Extractive Industries (International Monetary Fund, 2021), www.imf.org/en/Publications/WP/Issues/2021/01/15/Is-There-Money-on-the-Table-Evidence-on-the-Magnitude-of-Profit-Shifting-in-the-Extractive-49983.
-
141
It is perhaps surprising that Tanzania’s 50-50 sharing arrangement generates an AETR greater than 50 percent (with a discount rate of 10 percent). This is despite AETR measuring government take as the share of pre-tax profits, which is larger than “economic benefits” (given economic benefits exclude interest payments). This outcome results from the 50-50 split being based on actual cash flow. The government receives revenue before the mining company through input and production taxes that do not depend on the mine making a profit. Because of these earlier revenues, the government receives a larger share on a discounted basis.
-
142
As reported in the S&P Global database. Legal risks are “expropriation, state contract alteration and contract enforcement risks.” Tax risks are “tax increase and tax inconsistency risks.” Control Risks scores these risks as still “very high” and “high” respectively (following Tanzania’s overhaul of extractives sector laws and other actions against existing mines in 2017) but reducing.
-
143
With a discount rate of 10 percent. While Ecuador’s sharing mechanism does not account for the labor profit share because none of it will go to the government from 2024 onwards, I have included it in the AETR because it is a tax on the project. The Democratic Republic of Congo regime has an excess profits tax that is triggered for a mine when the realized price is at least 25 percent higher than the price in its feasibility study. I assumed that the feasibility study has a price of $1,300 per ounce, so the excess profits tax is not triggered.
-
144
Total benefits in this case are a project’s revenues minus operating costs and replacement capital (but not minus exploration and development capital). This cash flow represents the money available to pay back the initial investment and provide a return. The government share of it is a common measure of progressivity.
-
145
Wen, Progressive Taxation of Extractive Resources as Second-Best Optimal Policy.
-
146
With a discount rate of 10 percent. The results for only some countries are shown to clearly depict each data point. The results for all the evaluated countries can be found in my model.
-
147
Scurfield, “Tanzania Strikes a Better Balance with its Mining Fiscal Regime.”
-
148
This feature is not fully reflected in Figure 5 given that “total benefits” use a slightly different definition of profits and are based on discounted cash flows.
-
149
With a gold price of $1,600 per ounce.
-
150
For example, an average 62 percent of respondents to the Fraser Institute surveys between 2017 and 2019 said the current implementation of Tanzania’s legal system would strongly discourage investment, and 73 percent said regulatory uncertainty would. See, e.g., Ashley Stedman, Jairo Yunis and Elmira Aliakbari, Fraser Institute Annual Survey of Mining Companies 2019 (Fraser Institute, 2020), www.fraserinstitute.org/studies/annual-survey-of-mining-companies-2019.
-
151
With a low-profit mine and a gold price of $1,600 per ounce.
-
152
Tax avoidance could extend the Philippines’ recovery period, and therefore delay the payment of some taxes including import duty and interest withholding tax, given the end of the recovery period depends on the reported profitability of a mine rather than an ex-ante assessment. However, the rule that the recovery period must end five years from the start of production regardless of whether pre-production expenses have been recouped limits the extent to which it can be extended.
-
153
The merits of these measures require further scrutiny. E.g., taking a share of loan repayments could result in lenders charging a higher interest rate to ensure they still recoup their loan and a minimum return. This would not only reduce taxable income but also make it harder for the government to assess whether an interest rate is reasonable, because it would not be comparable with industry benchmarks. It can also be difficult for a government to always determine whether a loan is from a related party or not. However, these considerations are outside the scope of this analysis.
-
154
Natural Resource Governance Institute (NRGI), Natural Resource Charter, 2nd edition, 2014, resourcegovernance.org/analysis-tools/publications/natural-resource-charter-2nd-ed.
-
155
Although its exclusion of several significant taxes from the government’s share of benefits means low-profit mines may still be impacted.
-
156
With a gold price of $1,600 per ounce.
-
157
Anna Fleming, Thomas Lassourd and David Manley, “Variable Royalties: an Answer to Volatile Mineral Prices?” in Handbook on the Future of Resource Taxation, African Tax Administration Forum and Intergovernmental Forum on Mining, Minerals, Metals and Sustainable Development (forthcoming), www.iisd.org/publications/brief/future-resource-taxation-roadmap.
-
158
Ensuring that interest rates used as a comparison apply to comparable assets with a similar risk profile is challenging, but rules of this nature have been successful in reducing profit shifting in other countries. See Beer and Devlin, Is There Money on the Table?.
-
159
The main taxes listed are VAT, royalty and corporate income tax. The regime also includes a share of pre-tax profits that is currently divided between the company’s workers and the government, with the portion received by the government included in its accumulated benefits. However, a recent court ruling means that all this labor profit share will go to workers from the start of 2024 and therefore none of it will be included in government benefits.
-
160
The discount rate used is specific to each mine and based on its weighted average cost of capital (WACC). I have assumed that WACC is around 7 percent in real terms. This is based on the typical discount rate for equity shareholders used by industry and government analysts of 8 percent in real terms, and the current average cost of debt for the mining sector as reported by Aswath Damodaran, Damodaran Online, www.pages.stern.nyu.edu/~adamodar.
-
161
Republic of the Philippines, Financial or Technical Assistance Agreement, mgb.gov.ph/attachments/article/79/PFC_FTAA.pdf.
-
162
For example, some terms in the original FTAA for an OceanaGold mine differed in some areas: Republic of the Philippines, Financial or Technical Assistance Agreement with Arimco Mining Corporation, 1994, www.resourcecontracts.org/contract/ocds-591adf-2792396017. I understand that the recently signed extension to this agreement has slightly different terms again.
-
163
A template of the FARI model and a user guide that explains all the concepts and workings of the model are available at International Monetary Fund, “Fiscal Analysis of Resource Industries,”www.imf.org/external/np/fad/fari.
Triple Win: How Mining Can Benefit Africa’s Citizens, Their Environment and the Energy Transition

Key messages
-
Africa’s metals are essential to the rapid transition of energy systems away from fossil fuels. Africa holds 19 percent of the global reserves of metals required to make a standard battery-powered electric vehicle. The continent has at least a fifth of the world’s reserves in a dozen minerals that are critical for the energy transition.
-
This time must be different. Africans have not benefited sufficiently from mining in the past, and mining has led to deforestation and pollution. The mining industry has contributed eight percent of total government revenues in the 15 most mining-dependent African economies but has generated few opportunities for African businesses in supplier segments and value chains using the minerals. Furthermore, globally, the metal mining industry contributes 10 percent of emissions on average and indirectly causes seven percent of deforestation.
-
A triple-win is possible and necessary. A better deal for Africans will help reduce risks for investors, and support global industry efforts to secure more metals. While protecting the environment from mining will ensure efforts to move to a more sustainable way of life are not in vain. Mining governance must work for each of African citizens, the environment and the energy transition if it is to work for any of them.
-
Time is of the essence. There are only 28 years remaining until countries representing two-thirds of the global economy aim to have “net zero” emissions, yet it takes on average 17 years for the mining industry to develop a mineral discovery and start production.
-
Success doesn’t require “reinventing the wheel.” Numerous existing policy approaches will help. Seven stand out that require the combined action of international and regional authorities, companies and governments:
-
Establish “no-go” environmental zones
-
Fund geological surveys
-
Develop value chains, including those that will benefit Africa’s own energy transition
-
Fund renewable energy for mining, processing and battery production
-
Support the development of African suppliers to mining companies
-
Transfer knowledge
-
Coordinate across the region
-
-
These won’t work unless the foundations of governance are in place. This means improved governmental capacity to design and implement policies, and transparent, accountable, and corruption-free governments and companies. Seventy percent of African countries with transition mineral reserves rank in the bottom half of indices measuring corruption. While only 16 percent of current producers systematically disclose all or most mining contracts.
A triple win for Africans, their environment and the energy transition
The world faces three related challenges. First: To stop average global temperatures from rising by more than 1.5 degrees, or at least well below 2 degrees, humankind must accelerate the ongoing transition from fossil fuel energy to renewable energy. Second: Governments of countries constituting two-thirds of the world economy aim to reach net zero emissions by 2050, only 28 years from now. Last: The technologies needed for the transition are metal-intensive, and so transition requires a significant expansion in metal supply.1
However, mining and processing these metals creates two further challenges. These industries themselves emit large amounts of carbon dioxide, and cause deforestation and local pollution. It is in humanity’s interest to ensure that this destruction does not counteract the climate benefits of energy transition.
Also, many of the mineral reserves needed for the energy transition are in Africa.2 The history of mining in Africa is riddled with injustices, and few Africans can claim to have benefited from mineral extraction. Without further policy change, this will continue. Africans will see their minerals used to decarbonize the economies of wealthier countries and will not themselves benefit from the extraction—all while enduring some of the worst impacts of climate change. African officials and civil society actors have made clear that mining must change to benefit Africans in mineral-rich countries.
Meeting African demands is in the interest of energy transition industries and humanity more broadly. Mining companies must invest more in getting minerals out of the ground and processing them but have been reluctant so far.
This is because they have sought to avoid oversupplying markets and causing a slump, are uncertain of the pace of the energy transition, and wary of the risks of operating in parts of Africa.3 But mining companies can reduce these risks by forging better deals with mining countries to create more harmony between the governments, businesses and various parties involved in mining and the various industries producing technologies for the energy transition.
This is a “triple-win,” a set of policies to ensure that:
-
people in African mining countries benefit from mining
-
the global transition benefits from an increased supply of metals
-
mining damage to the environment and communities is minimized and mitigated so that pursing the transition is worthwhile
Furthermore, any one party only benefits if everyone else wins too. Cooperation is key.
How to achieve a triple win
Fortunately, this does not require a complete revolution in how governments and companies govern and operate within the mining sector. Officials, executives, and civil society actors know well and agree upon the broad areas of required policy.4 However, some changes to these established governance programs are still needed. This is to address four emerging problems.
First, development partners should identify successful approaches and fund and scale these across the continent, rather than reducing funding for economic development programs to focus on more explicitly climate-related work.
Second, African governments, with the support of development partners, must close the gap between policies and their implementation; many countries have passed quality policies but failed to implement them.5
Third, global powers have heightened concerns around energy security and increased awareness of the economic clout that dominance of clean energy technologies will provide. Government leaders are scrambling to create national renewable energy and e-mobility industries in China, Europe and North America. This has changed the parameters that climate donors and development partners must work within.6
Fourth, there is a dilemma between increasing mineral supply to meet climate goals and improving governance, an often decades-long process. Companies have exacerbated this by wanting to profit from current high prices, whilst also calling for speed in the name of addressing the climate crisis.7 While governments in mining countries fear missing out on the current boom in demand for their metals.
The race between the industrialized countries to develop their own industries to produce energy transition technologies and the urgency in preventing further catastrophic climate change puts low-income mining countries in a strong position to demand more benefits.8 But it could also encourage people with the power to make these decisions to strike backroom deals and fast-track extraction. Such impatience has previously worsened governance in the long-run and resulted in fewer benefits for citizens and more risks for companies.
The world therefore needs a rapid improvement in mining governance. Yet, in the past, donor programs have sometimes failed to achieve governance goals by pushing them too rapidly.9
Despite these challenges, all parties share an interest and have the potential to implement a triple-win deal. Climate policy makers in governments meeting at COP27; donors and international finance institutions in both the climate and development space; international authorities and African regional authorities (such as the African Union and African Development Bank); mining companies, energy transition technology industries and their investors (who are particularly incentivised to think short-term); governments in mining countries in Africa who owe a better deal to their people:
Humanity cannot afford to repeat the mistakes that have beset Africa’s mining in the past. To achieve a triple win, this time must be different.
Policies for a mining triple win
A triple-win in mining is exemplified in the following seven policy recommendations, derived from the huge breadth of studies on these subjects. The remainder of the report gives details and additional recommendations. These ideas require further study but can form an agenda for discussion among various stakeholders and could inform the African Green Minerals Strategy and implementation of the Africa Mining Vision.
- Establish mining no-go zones
Once prospectors discover reserves, companies and governments are subject to strong incentives to develop them. Once a mine is developed, environmental protection is typically weak. To prevent environmental destruction, governments should establish areas in which exploration is unlawful. These areas should include not only UNESCO World Heritage Sites, but vast tracts of forest and areas of valuable biodiversity. To create the incentive to maintain these zones, donors should link them with global financing, such as the funding that a group of them have committed to protecting the Congolese forests. Donors should predicate other policies recommended here on the condition that mining, processing plants and other linked industries are never established in a no-go zone. - Fund geological surveys
To expand Africa’s mineral reserves, donors should fund surveys to reduce geological risk. The World Bank and others already fund such surveys, but more funding is needed. These surveys should also be conducted far outside no-go zones. If surveys identify more reserves outside these zones, governments may find it easier to stop extraction inside the zones. Private sector companies should have access to the data for exploration, and governments should improve their geological data management. - Develop value chains, including those that benefit Africa’s own energy transition
Southern Africa’s efforts to develop nickel, manganese and cobalt battery production might result in exporting Precursor material (see Figure 5). In addition, there is large potential demand in the region for electric two- and three-wheel vehicles, and stationary battery storage for use in household electrification and mini-grids. African industries based on lithium, iron and phosphate battery chemistry may also be viable. Africa doesn’t currently produce much lithium, but African companies could start first with battery assembly and eventually ascend the value chain to produce cells and cathodes, ultimately using Africa’s own minerals to feed these processes. - Fund renewable energy for mining, processing, and battery production
Africa has greater potential than most other regions to produce metals and processed goods in a low-emission way, but investors’ risks are prohibitive. Climate donors and development partners could increase funds to governments and companies to de-risk renewable energy projects that power mining, processors, and the other energy-intensive activities along battery/ electric vehicle value chains. - Support African suppliers to the mining industry
A competitive supply base for the mining sector would generate jobs for Africans and lower mining costs for the transition. But African businesses struggle to attract capital. African companies providing goods and services to the mining sector could benefit from funds jointly capitalized by governments, mining companies, and regional and international financial institutions, in addition to private capital. - Transfer knowledge
Establishment of competitive supplier companies and industries along these value chains requires African managers and workers with more skills and knowledge. Foreign and local companies should partner more, and donors should fund universities and other researchers in the region. - Coordinate across the region
Supplier companies and industries must operate at scale to be competitive, and multiple countries must cooperate to share minerals, workers and infrastructure to support robust value chains. Governments could coordinate to develop large-scale companies, and multinational mining companies could coordinate to set clear goods and services needs to inform supplier development plans. But regionalization will benefit some countries more than others. To encourage cooperation, the proposed the Southern African Development Community (SADC) Regional Mining Vision suggests mechanisms to coordinate and redistribute benefits across countries.
These policies must rest on firm foundations of governance, otherwise they will be poorly designed, unimplemented and unfollowed. In addition to pursuing these policy areas, donors and development partners, governments, and companies should continue to focus on improving government capacities and promote transparent and accountable public and corporate governance and anticorruption. Policy makers should heed the proliferating lessons from many years of governance programs. Including by partnering with African civil society to design and implement these policies to ensure that citizens’ views are considered, to tap the available expertise in these organizations, and as a check on governments and companies.
1. A win for the energy transition

Energy transition requires more investment in mining
Resource-intensive consumption by the wealthy is a major contributor to planetary warming. In 2019, the richest 10 percent of humanity (mostly in North America, Europe, but also the rich in East Asia and elsewhere) were responsible for 48 percent of global emissions. The bottom 50 percent were responsible for only 12 percent.10 In addition, climate change is impacting the poorest regions and the poorest people the most, because of both their geography and the sparse resources these societies must cope with change. Accelerating the energy transition should not further propagate such injustices. Resource-intensive consumption probably needs to fall.11
However, until that time, manufacturers of the technologies required to decarbonize consumption require metals. In this way the energy transition is driving a shift from fossil fuel dependence to metal dependence. For instance, battery electric vehicles (BEVs) require twice the metal of a standard internal combustion engine car. Solar and wind plants respectively require three and four times the metal needed for an energy-equivalent gas- fired power plant.12 This increases demand for both rarer “critical minerals” like cobalt as well as relatively abundant metals such as copper and aluminium. All these metals and minerals required in the “transition industries” that produce technology for the energy transition we call “transition metals and minerals.”
Manufacturers can obtain a portion of metal supply from recycling. But recycling is unlikely to replace the need to mine in the near future. Recycling of cobalt and lithium may only supply five and ten percent of the respective markets by 2030.13 As transition technologies such as BEVs, electric grid infrastructure and wind turbines proliferate, the amount of metal in circulation will fall short of expanding demand. In the future recycling might become a larger part of the solution as more metal comes into circulation, product design improves to aid the separation of metals during recycling, and recycling itself evolves to use less energy.
Furthermore, while technological innovation can translate into less reliance for some metals, it can also lead to increased demand for others. Engineers have already responded to metal scarcity; for example, the nickel, manganese and cobalt (NMC) 811 battery chemistry uses a quarter less cobalt than the original NMC 111 battery. Yet, the NMC 811 also uses 75 percent more nickel, a metal that the European Union and US Geological Survey recently added to their critical mineral lists.14
Therefore, until consumption is less resource- intensive and recycling is more viable, manufacturers will require miners to extract more metal from the ground—and quickly. Only 28 years remain until countries representing about two-thirds of the global economy aim to have “net zero” emissions.15 Reaching that goal requires producing millions of electric vehicles, wind turbines, and other transition technologies in the coming decades.
This in turn requires an even steeper surge in investment. Meeting climate goals may require a tripling of investment from 2021 to 2036, from about $0.5 trillion to $1.7 trillion.16 But so far companies have been unwilling to invest sufficiently in mines to accelerate the energy transition despite higher prices, which might slow the transition; the time it takes to develop mines is long and getting longer; and protests, disputes and other disruptions are all slowing supply. Africa, however, may hold the answer.
Africa is an essential source of transition minerals
The African continent already dominates global reserves of several transition minerals. (See Figure 1.)17 African countries hold 19 percent of the global reserves of metals required to make a standard battery electric vehicle.18 Most of Africa’s transition minerals discovered so far are in southern Africa.
Not only does mining in Africa already matter for the energy transition, but the continent is still relatively unexplored and has the lowest concentration of known mineral wealth in the world. (See Figure 2.) More exploration would likely reveal new deposits to accelerate the transition and unlock new subsoil wealth for Africans.
Attracting exploration investment partly requires reducing geological risk for companies. To do this, African governments can fund geological surveys to provide companies with an initial indication of where reserves might be located. Companies can then confirm this potential with more intensive exploration. But these surveys are expensive. The World Bank has therefore been providing support. Recent World Bank-funded surveys have indicated the potential for significant reserves in Malawi and Uganda, for example.19 More funding for surveys from donors would reveal more minerals that would both supply the energy transition and benefit African government treasuries and mining industries. New surveys are especially needed as many previous surveys were conducted before the recognition that certain minerals are critical to transition technology.20 As the African Development Bank’s African Mineral Development Centre theory of change advocates, governments should also cooperate on surveys with neighboring countries.21 Geology doesn’t respect national boundaries; knowledge about minerals on one side of a border can help exploration efforts on the other.
Discovery of new reserves in less environmentally sensitive areas could also reduce the push to explore in the most environmentally sensitive areas such as rainforests and sea beds. However, to truly be part of a triple win, governments, regional and international authorities should only commission surveys far away from these areas—establishing them as “no-go zones” where exploration and extraction are forbidden.
Figure 1. Africa’s shares of global reserves of transition minerals22
Figure 2. Comparison of exploration and mineral reserves per square kilometer across each region in the world23
Better mining governance can accelerate the transition
Better governance can accelerate investment and shorten mine development times
Figure 3. Comparison of countries’ mining governance quality and attractiveness to mining investors across the world24
Africa is underexplored in part because mining authorities have inadequately managed geological data, and mining companies have considered much of the continent commercially risky.25 For example, a South African strategy to boost exploration cites poor policy implementation, insufficient electricity, strikes and community unrest, and poor geological data.26 Better governance—by ensuring mining communities benefit and in turn providing a more secure environment for investors—is strongly associated with increased exploration activity.27 And quality of mining governance positively correlates with investors’ perception of country attractiveness. (See Figure 3.)
Increased exploration is only one part of the solution. Discovery does not automatically lead to development. By amount of metal reserves discovered since 1950, companies have developed just over half of projects across the world.28 Even mines that companies develop take an average of 17 years from discovery to the start of production.29 For copper mines, most of this time (12.5 years) was for discovery, exploration, studies and permitting. The rest was for construction planning (1.8 years) and for construction (2.6 years).30
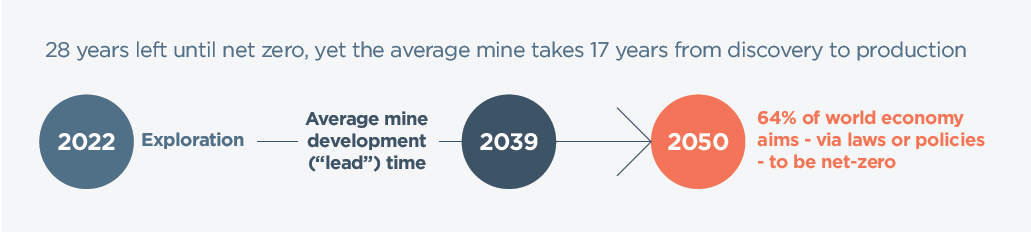
Three factors shorten lead times.31 Higher market prices for minerals can hasten development, but at a delay. The price increases that began in 2004 only resulted in an acceleration in mine production in 2012. During that eight-year period the price of copper tripled.32 Nor is this a solution for the energy transition as it would increase costs for transition industries.
Two other factors are conducive to accelerating the energy transition. First physical qualities: large and high quality of deposit; mineral type (e.g., lithium and gold are faster than nickel and copper); shallower deposit depths; and further developing existing mines rather than starting from scratch with a greenfield development.
Two, higher-quality governance facilitates development. One study has indicated that if African countries improved their quality of governance to the level of Chile, they could shorten mine lead times by an average of two to three years.33 Policy makers cannot control most of the physical factors of mining and market price, but they can control governance. Specifically, they can focus on improving management of surveys and permitting phases to shorten lead times while still ensuring fair deals for their countries’ minerals.34
Better governance can reduce disruptions to the highly concentrated supply of minerals across Africa
Stable supply relies on stable relationships between mining companies, governments and communities. Discontent leads to disruption which is a risk particularly for industries that require transition minerals that are geographically concentrated.
Resources can be concentrated both at the national level, as seen in Figure 4, and at the mine level. For example, in 2020, four mines— Kamoto, Tenke Fungurume, Metalkol RTR and Etoile—all in the Democratic Republic of the Congo (DRC), produced 41 percent of global cobalt supply.35 In such cases a single company dispute with a government or local community risks cutting off large shares of global supply. These disruptions also increase risks to lenders who require higher interest rates from companies, thereby increasing costs and reducing returns.36
Figure 4. African countries with large shares of global transition mineral reserves37
Mining Disruptions
Tax disputes and expropriation. In 2019 Vedanta became involved in a tax dispute with the Zambian government, leading to the seizure of its Konkola Copper Mines subsidiary, removing 90,000 tons per year of mined copper output and 310,000 tons per year of smelter capacity from global supply.38
Labor strikes. Mining analysts typically assume strikes results in five percent of global production lost each year.39
In 2019, workers at the world’s largest copper producer, Codelco, began a strike at its Chuquicamata mine, removing 393 tons per day of copper from the market.40
Environment. Vedanta’s 400,000-ton-per-year Tuticorin smelter in the Indian state of Tamil Nadu has been offline since May 2018 after the company failed to protect the local environment.41
A similar dispute between MMG Ltd. and the local community caused local output at Peru’s Las Bambas mine to drop 10 percent year-on-year.42
Serbia withdrew Rio Tinto’s exploration permit in early 2022 after protests over plans for a large lithium mine.43
Export bans. Governments ban mineral exports to encourage domestic downstream processing industries. In the case of Indonesia this has led to the development of some domestic processing, but it has taken a long time and in some cases has not happened. Tanzania attempted to establish domestic copper smelting by banning concentrate exports for several years, but failed due to insufficient economies of scale.44 A the time of writing, the country’s Ngualla mine—the world’s fifth largest rare earth deposit—is currently stalled due to a government requirement for local refining.45
Corruption. Alleged corruption and the resulting legal processes have held up development of the Simandou iron ore deposit in Guinea. The resource was discovered in the 1990s yet remains undeveloped. It holds the world’s largest untapped iron ore deposits.46
2. A win for citizens in Africa’s mining countries

Listen to African governments and civil societies’ demands for better deals
The extent to which African countries have benefited from past mining booms is unclear. Some studies suggest that many countries did benefit from the last boom, but that these benefits were less than many citizens hoped for. For example, socioeconomic indicators such as those in the Human Development Index on average improved in African countries with large mining sectors.47
However, performance has varied. Analysis of the “adjusted net saving rate”, which measures the amount each country saves and invests in economic assets less the decline in subsoil and other natural assets, indicates that countries like Zimbabwe and DRC have through disastrous governance effectively sold the national wealth for less than nothing.48
Even countries that show higher adjusted net saving rates could possibly have benefited more with stronger governance.49 For example, while governments do generate significant revenue from mining, recent IMF research suggests companies’ avoidance of corporate income tax could be costing 15 African mining countries around $600 million annually.50 Governments have also struggled to develop local supplier bases (“backward linkages”) and to add value to their raw minerals through processing (“forward linkages”). In some cases, citizens living near mining sites have struggled to benefit at all.51
As African governments and civil society have made clear, things must change. African civil society organizations have consistently called for a “new deal” in which mining draws on more locally sourced inputs and supplies downstream industries on the continent rather than simply feeding exports.52 Government officials in mining countries as well as the African Union (AU) and other regional bodies have echoed these demands, which are also informing the African Green Minerals Strategy. 53 54
Following are key elements of a mining triple win. Some of the recommendations are not new, but African governments and their development partners have yet to systematically invest in them. Doing so now is crucial.
Develop E-mobility and battery storage value chains
Several African governments and regional bodies aim to establish industries within the battery value chain, for both e-mobility and electricity storage. The move to establish these and other value chains for energy transition technologies in Africa has climate benefits too; it could translate into cheaper and greener products for manufacturing elsewhere. Unlike most high-income countries, African states have significant spare renewable energy potential.55 Some high-emission industrial activity—such as metal smelting—could relocate to Africa.
Figure 5: An electric vehicle battery value chain
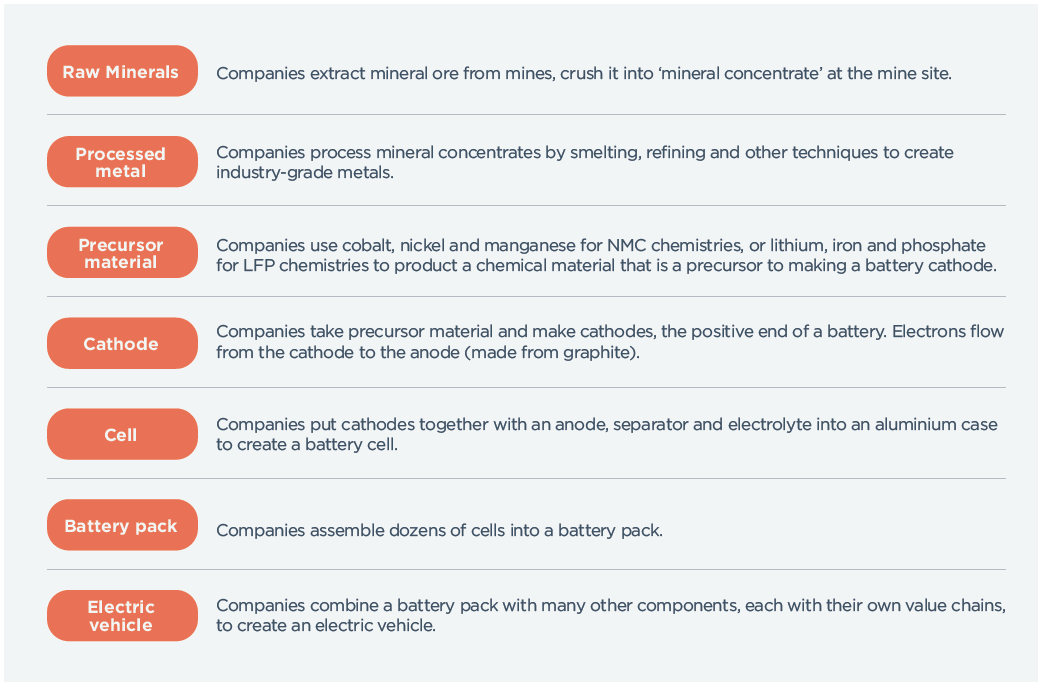
However, few African countries with mineral reserves have succeeded in efforts to establish industries downstream from mining. To change that, policymakers should:
Secure a supply of minerals and pool supply to achieve scale
Most processes along the battery chain benefit from scale economies, which require a large supply of inputs. This supply must be dependable to ensure plants are constantly running near capacity. No single African country has all the minerals required to produce batteries, particularly lithium. Countries will need to pool mineral supply to achieve the minimum scale and reliability in case supply from one mine stops. (See page 14 and 15) And with a significant amount of production already committed to overseas buyers through offtake agreements, governments will need options for securing supply for an African value chain. Increased exploration and discoveries will go some way to reducing this tension.
Provide cheap, reliable, and green energy
Metal processing requires substantial amounts of energy. Yet the DRC and much of southern Africa are short of industrial quantities of energy. The much-delayed Inga hydropower plants in the DRC will export their energy to South Africa. But if the Grand Inga dam is finally built, it could allow the DRC to process cobalt and copper with low carbon emissions.56 The international community should expand its support to increase the availability of cheap, reliable, and green energy in Africa for industry. Ensuring there is surplus energy for households could also induce local communities to accept the industries operating near where they live.57
Coordinate across the region
Governments in the region will have to closely collaborate and partner to create an African battery production industry. Recognizing this, the DRC and Zambia have established a “Joint Battery Council.”
Figure 6. Location of Africa’s battery mineral reserves and above ground assets needed for downstream industries 58
The African Continental Free Trade Agreement (AfCFTA) and other existing sub-regional free trade agreements will also facilitate coordination. But the location and benefits of activity will not be equal, particularly as some countries already have more capacity than others (as highlighted by their “above ground assets” in Figure 6). Those with the most minerals but the least potential to benefit could block efforts to coordinate. As a failed attempt at establishing a regional coltan refinery in South Africa showed, regional authorities must explore mechanisms for sharing not just the profits from an activity but also the wider economic benefits with producer countries.
The proposed SADC Regional Mining Vision proposes ways to ensure that disadvantaged countries can also supply other inputs, e.g., a common fund that pays the additional cost of transporting inputs from countries with weak transport infrastructure to where the activity is taking place.59
Develop large downstream markets for electric vehicles (particularly two- and three-wheelers)
Paradoxically, proximity to the mineral source is only a small factor in the location of downstream industries, since processed metals are relatively easy and inexpensive to transport. However, transport cost is still relevant for products closer to the raw extraction stage. Zambia has succeeded in developing copper smelting and refining to reduce the weight of exports, from concentrates to cathodes. Conversely, there is only a small manufacturing sector using this copper.
More important than proximity to the mineral source is the proximity to downstream markets, making some parts of the value chain more viable than others. This matters across the value chain. Cobalt from mines in DRC and Zambia, despite its high grade, usually contains many impurities. The next link in the battery value chain is producing ‘battery precursor material’, chemicals that are a precursor to making battery cathodes, themselves the ‘positive’ end of a battery. To produce precursors material, companies need to remove the impurities in mined cobalt. This process is more viable if companies locate the process plants near a cluster of other chemical plants.60
The next link involves creating battery cathodes. But these are difficult for companies to transport, so companies tend to locate cathode production close to battery cell manufacturing, the next link in the value chain.61 Lastly, cell manufacturing tends to be located close to EV manufacturers to benefit from quicker, more flexible delivery to customers.
Therefore, African industries along the battery value chain will be more viable if there is a market for battery-powered vehicles close by. It is even better if this market is large, since companies then benefit from scale economies.62 These factors matter in deciding which types of batteries to attempt to produce in Africa.
Given the DRC’s huge cobalt reserves, regional discussions have focused on developing industries in the nickel, manganese, and cobalt (NMC) battery value chain.63 NMC batteries are currently used in electric cars like the Nissan Leaf, Volkswagen e-Golf and Hyundai Kona. However, the African market for such cars is likely to remain small. Few people in Africa can afford them, and they require a reliable grid and charging infrastructure. Electric cars of any kind might only be a small part of the future African market: perhaps only 14 percent of EVs in Africa will be cars (of any type) by 2040.64
This makes it difficult for companies to be viable along the full value chain from mine to electric vehicle in southern Africa. One study suggests that producing battery precursor material could be viable if countries can coordinate to provide a reliable supply of minerals to a precursor chemical plant.65 But given the difficulties of transporting cathodes, processes further downstream from precursor production may be unviable until there is a large regional market for electric vehicles that use NMC batteries.
Conversely, Africa, following trends in India, is more likely to adopt electric two- and three- wheelers.66 Current two- and three-wheel electric vehicle models use an alternative battery chemistry: lithium, iron, and phosphate (LFP). LFP chemistries are also used in stationary power storage, useful for providing off-grid electricity for Africa’s dispersed population.
Therefore, in addition to developing part of the NMC battery value chain, African industries based on the LFP battery chemistry might also be viable.
Given Africa doesn’t currently produce much lithium, African industry might start at the other end of the value chain, with assembling battery packs from imported cells. South Africa already does this, assembling battery packs for mining equipment and refrigeration.
To go further up the chain, African industries need to invest in cell manufacturing plants. There is currently little incentive for investors, but three things could change this: a larger regional LFP market, more lithium discoveries and regional coordination on a lithium refinery.
Figure 7. Two options in locating parts of a battery value chain in Africa
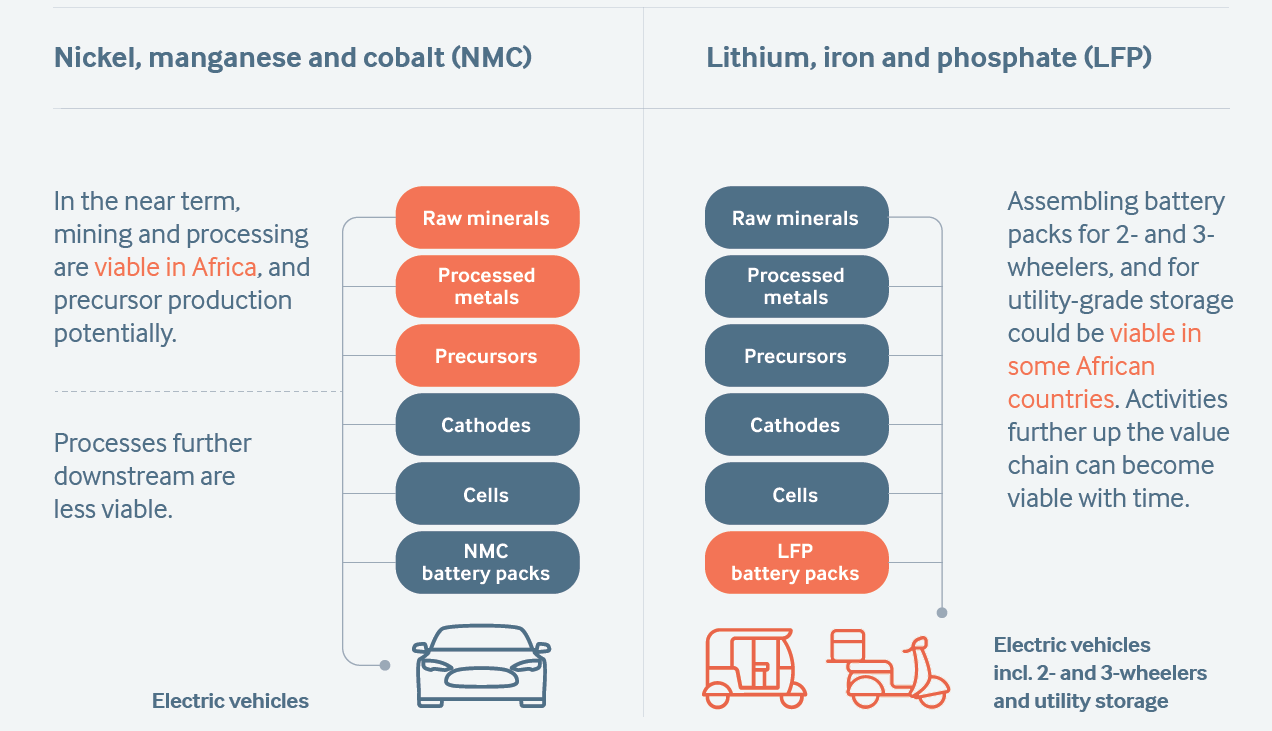
Although the African market for electric two- and three-wheeled vehicles is growing rapidly, it needs to grow even faster to support a viable set of battery and EV production industries. There are different ways that governments could help a market to grow. Governments often protected infant markets from foreign competition. But protection on its own rarely worked. Governments have had more success by promoting local companies instead. Rwanda’s recent e-mobility strategy paper suggests a promising shift in this direction.67 Donors could support multinational companies to invest in the sector (including in joint ventures with local companies) and fund EV infrastructure (such as battery swap stations).
The AfCFTA can also help to develop this market for African producers by enabling African countries to focus on different links in the value chain. However, to realize this potential, governments must significantly reduce non-tariff barriers, such as procedural delays at borders. Governments within the trading region must also define and implement the AfCFTA Rules of Origin—the percentage of African materials used—to determine whether the AfCFTA applies. This will prevent foreign makers of semi- manufactured goods from avoiding tariffs and undercutting African producers.
Be ready for changes to battery technologies
The battery chemistries in demand today may not be the batteries of the future.68 Lithium-ion batteries—like NMC and LFP batteries—will likely dominate for at least the next decade.69 But the cobalt content in NMC chemistries has already fallen significantly, and there is growing interest from manufacturers in sodium-ion batteries. Some capabilities are transferable between some battery technologies—for example, between different lithium-ion batteries, and between lithium-ion and sodium-ion batteries—but not between others. Policy makers must consider that investments made for one battery chemistry may become “stranded.” African countries can insulate themselves from this risk in part by developing chemistries suited to the region’s needs and geological mineral profile. Local and foreign companies, researchers and international partners could collaborate to create appropriate technologies.
Nurture mining suppliers
Both the energy transition and African countries could benefit significantly if governments nurture competitive local companies
Developing African suppliers to the mining industry has perhaps the most potential among all the benefits countries can derive from mining. Suppliers provide products and services to mining companies. This can range from products such pick-up trucks, tyres, drills, conveyor belts, and specific replacement parts, and services such as catering, surveying, and human resource management. To name only few of a whole host of products and services that suppliers provide. There are also many other mining and processing tasks that a mining company that holds the mining license might also sub-contract to other companies. In total, the procurement of goods and services usually amounts to 50 to 70 percent of all money spent in host countries. Usually more than payments to governments, worker salaries and wages, and community investment combined (see Figure 8).70
Figure 8. Example of mining company spending in a producer country71
For the international community and companies, efficient local suppliers lead to lower costs for mining companies.72
Mining companies need to import fewer goods, and local expertise solves local problems. By procuring more
from the local market and establishing a wide network of local suppliers, the mining industry also has stronger ties to their host countries, reducing disputes and discontent.
The countries that have achieved the most development from mining - such as Canada, Australia, Chile, and South Africa - all have significant supplier industries. In both Australia and Canada there are more people employed at supplier firms than in mining itself.73
However, in African countries outside South Africa, much of procurement value is spent on imported goods resold by domestic suppliers, without creating many jobs, transferring business knowledge to other economic sectors, or substantially reduce mining costs. The challenge is to develop competitive African companies that can produce more of the supply chain themselves.
Policies to nurture competitive African suppliers
The Intergovernmental Forum on Mining, Minerals, Metals and Sustainable Development (IGF), the International Finance Corporation (IFC) and Mining Shared Value have contributed to a growing understanding of what works best in developing supplier companies in Africa.74
African governments have often favored “local content” rules that stipulate how much mining companies should procure from local markets. But these have yielded mixed results. Governments usually do not monitor mining company procurement, and some mining companies have procured from suppliers with local political links rather than the most competitive. Most importantly, governments have often failed to pair local content rules with support to develop businesses that can meet mining companies’ demand. This is particularly important because cheap imports from China and other large developing economies means that African countries will struggle to create viable supply companies without government intervention.
But there are alternative approaches:
Funding for local entrepreneurs would overcome most African companies’ capital constraints. This could come from the government and companies, as is the case in South Africa.75 Development finance institutions and donors could also capitalize venture funds for this purpose.76 To encourage regional coordination on supplier development, regional authorities like the African Development Bank could manage some of these funds at a regional level.
Consult
Governments should research and consult business to identify what goods and services to target for supplying to the mining industry. The Ghana Minerals Commission and Chamber of Mines worked together to create a list of goods and services that companies must procure from Ghanaian suppliers, rather than using a blanket total percentage as a requirement.77
Coordinate for scale
Supplier companies need scale economies to be competitive. A single mine is generally too small to create enough demand. However, mining companies working through industry chambers can coordinate and pool their demand for suppliers. At a regional level, mining countries could coordinate to create even more scale for suppliers. The proposed SADC Regional Mining Vision and the ECOWAS Model Mining and Minerals Development Act identify this as an opportunity; they suggest that a country should recognize local content created in other member states. The DRC- Zambia partnership on copper and cobalt mining is one opportunity to experiment with coordination for scale.
Learn from experienced suppliers
Many African countries lack operational capabilities and managerial knowledge. Those African businesses that have succeeded have learned from others. Joint ventures, where internationally competitive supplier firms partner with local suppliers, facilitate learning. In Canada and Australia, mining companies require large-scale suppliers to form joint ventures with Indigenous suppliers, allowing the Indigenous companies to develop their own capacity. Donors could also support trade fairs between foreign and African mining suppliers to help entrepreneurs network.
Market development and trade barriers
As with developing value chains, the African Continental Free Trade Area will be important in helping supplier companies develop.
Create jobs within supplier companies
Share of direct mining employment is already high and further growth is limited, so creating jobs with suppliers has more potential
Even though the mining sector is capital- intensive, companies still employ significant numbers of people. Workers involved in core mining activities tend to make above-average salaries in most countries.
In contrast to the share of procurement between host and investor countries, the share of Africans that are direct employees is already much higher. While expatriates from outside the continent commonly hold the most senior management roles in African mining, most direct employees—both permanent and contract staff—are nationals.
There are several reasons. One is cost. Internationally competitive salaries for expatriates are much higher than the equivalent African salaries and transporting and housing expatriates is hugely costly. Host country citizens are likely to enhance their skills and capacities by working in mining operations, which often involve on-the-job training. Companies can also exert much more control and monitoring of activities “inside the fence” compared to the activities of suppliers of goods and services.
Governments do aim to increase the share of national citizens in the direct employment of mining companies. Governments use “demand-side policies” that impose quotas and percentage limits on expatriate employees. “Supply-side policies” conversely entail developing skills, including the prerequisite competencies that act as a foundation for core mining tasks (for example mathematics and vocational education). Companies and the international community can facilitate government efforts by supporting standardization and increasing certification for skills that workers have acquired.
However, employment policies are unlikely to yield many more jobs. Automation and other industry changes mean direct employment will likely decline.
Governments could focus instead on training, prioritizing technical education and highly skilled mid-to-upper management. However, programs should focus on employees within supplier firms, rather than those directly employed by mining companies. Employment policies might best focus on developing supplier companies and helping them employ more Africans.
Collect and manage tax revenues
African countries earn significant sums from mining, despite large-scale tax avoidance by companies. Effective revenue management remains a priority.
Many African government officials and civil society actors are concerned that corporate tax abusers have cheated their public accounts of billions of dollars of tax revenue. The International Monetary Fund (IMF) estimated that treasuries across the 15 most mineral-dependent countries in sub-Saharan Africa have potentially lost $600 million a year from companies avoiding mining corporate income tax.78
This estimated tax loss is equal to about 5 percent of the total revenues the governments of these 15 countries earned from mining.79 Addressing tax abuse80 might increase revenues by this amount, but governments must also look elsewhere for further revenue. First, given how little exploration has occurred in Africa, improving governance (rather than just reducing tax rates), could radically expand the tax base.
A second area of focus is tax rate adjustment. While legislated tax rates have recently increased across the region,81 rates negotiated in contracts for individual projects remain low in many countries. This is due in part to governments competing to attract investment by offering tax incentives that are often unnecessarily generous.82
Given the relationship shown in Figure 3, governments can make their countries more attractive to investors by improving other areas of governance, rather than lowering tax rates. Such missteps are particularly costly for governments that have legally agreed with companies that they will not change contract terms like taxes (known as stabilization clauses).83
Despite these issues, African governments still collect substantial amounts from mining companies. For the 15 most mineral-rich countries in sub-Saharan Africa, 8 percent of total government revenues. Across the continent more generally, Africa’s transition mineral reserves are currently worth about $2.97 trillion.84 Based on past collection rates including losses from tax abuse, and assuming no improvement in tax collection, Africa’s transition mineral reserves could generate $475 billion in taxes over the life of the reserves.85
Furthermore, despite the benefits of value chain development and supplier policies, collecting and investing taxes remains the best way for governments of mineral-dependent economies to fund programs to alleviate poverty and to diversify their economies. These economies have suffered from volatile metal prices and “Dutch disease,” which inhibits growth of other export sectors. Investing mining revenues in developing the rest of the economy ensures that these economies no longer depend on just one industry and helps lift citizens out of poverty.86
Therefore, how governments use the tax revenues they receive is still of paramount importance. A country’s “adjusted net saving rate” is one indicator of performance in revenue management. When compared to the potential revenues a government could collect (measured as resource rent), the adjusted net savings gives an approximate measure of how well countries actually collect and spend taxes from mining industries. By this measure, performance varies considerably. Since 2000, Zambia has received about the same rent per unit of GDP as Guinea, but Zambia’s adjusted savings rate has been 17 percent, while Guinea’s rate has been -11 percent. However, most African mining countries do not have fiscal rules for mining, and of those that do, few place controls on how governments spend the revenues.87 The potential boom in revenues from transition minerals serves as a reminder of the importance of a robust revenue management framework.
Some countries have successfully implemented policies to collect and transform mining revenues into sustainable development
Below are a few examples that governments and donors could further support, strengthen and adopt:
Sierra Leone has moved away from negotiating tax terms for individual projects, reducing the risk of mistakes. Mali has reduced the stability period permitted in contracts from 30 years—significantly longer than necessary to ensure the bankability of projects—to 12 years from the issuance of a mining license.
Experiment with new tax designs
Governments are experimenting with new tax designs that balance the need to attract investment while minimizing the opportunities for companies to avoid taxes. Governments in Côte d’Ivoire, Guinea and Mauritania, among others, have levied “variable royalties” that accommodate the inherent volatility of metal markets while still being easier to administer than corporate income taxes which companies find relatively easy to avoid paying.88
Resource tax authorities
Despite frequent changes to its tax code and disputes with taxpayers, Zambian authorities and donors have invested in the Zambia Tax Authority and mining ministry, significantly expanding the expertise and information they have to monitor the copper mining industry.
Coordinate and share expertise across the region
Several pan-African bodies are supporting tax policy making and administration; these include the African Development Bank, the African
Tax Administration Forum and the African Tax Institute. Providing capacity building support on economic modeling, sharing expertise and experience across countries, and working on international aspects of taxation that can help tax officials perform their roles more effectively.
Disclose contract and payments to governments
Some governments have been increasingly transparent, enabling more public scrutiny, and therefore increasing the incentive for governments and companies to sign fair deals. However, there is room for much more progress: specifically within sub-Saharan Africa, 44 percent of countries have legislated contract disclosure, while only 16 percent systematically disclose all or most mining contracts.89 Eighty-five percent in this group also disclose payments, though not always in a timely, accessible way.90
Manage government revenues
Having collected revenues, a government must spend or save them wisely, and avoid problems of economic volatility, inflation and waste. Outside of Africa, Chile has done this effectively with its copper earnings. Chile has a rule that determines how much of its mining revenues the government can spend on present day needs and how much it must invest for longer-term projects. As copper revenues are so volatile, officials use its Economic and Social Stabilization Fund to save surplus revenues until the next downturn.91
Stamp out corruption
Corruption tends to worsen during booms; everyone has a role in combating it now
Seventy percent of African countries with transition mineral reserves rank in the bottom half of Transparency International’s Corruption Perceptions Index.92
Corruption reduces the benefits from mining for most Africans, while increasing the risk of social and environmental harm.93 It also disrupts mineral supply by deterring investment, nurturing arbitrary and unpredictable regulatory environments, and potentially exposing companies to long-term liability and sanctions.94
Past commodity booms corresponded with an increase in corruption, and this could reoccur as the world scrambles to meet the demand of transition minerals.95 As profits soar, public and private sector actors are more likely to embrace risks, including engaging in or turning a blind eye to graft. During booms, government officials and company executives engage in frenzied, fast-paced dealmaking, which can facilitate corruption.
The integration of downstream companies (for example battery and EV players) in order to secure mineral supplies also means company executives are assuming new roles and negotiating unprecedented deals. They are managing unfamiliar risks, while regulators and oversight actors struggle to keep up, particularly as the dominance of powerful multinational companies across multiple stages of the supply chain can inhibit accountability.
How to fight corruption
Governments, the international community, and companies must all act to fight corruption. The following practices are derived from the Extractive Industries Transparency Initiative (EITI) Standard, the Organisation for Economic Co-operation and Development (OECD) Due Diligence Guidance for Responsible Chains of Minerals, and NRGI’s work on corruption in the extractive sector.96
Identify risks and develop mitigation plans
Governments and companies should proactively identify risks in their strategies, policies and activities, particularly in specific areas where corruption regularly occurs, including: the award of licenses, permits and approvals; the procurement of goods and services; state-owned enterprise activities; and commodity trading. Some examples of good practice are emerging. Colombia’s mining agency recently mapped risks and released the analysis for public consultation, while mining company BHP now requires its subcontractors to provide beneficial ownership information.97 Companies should also support other entities, such as their suppliers and customers, to integrate these checks.
Reduce the use of agents and intermediaries
One common form of corruption is company staff paying bribes to public officials via agents and intermediaries. Companies should follow the example of trader Trafigura, which has committed to no longer hiring third parties to perform “business development” functions.98 They should exert extensive control over relationships with any remaining intermediaries.99
Increase transparency
It is easier for authorities and civil societies to uncover corruption if companies and governments officials disclose contracts, payments and the beneficial owners of assets. As noted on the previous page, contract and payment disclosures are increasing, albeit not quickly enough. Beneficial ownership transparency is particularly lagging, though recent reforms by Ghanaian and Nigerian authorities to increase the coverage of their requirements are promising.100
Support oversight actors
Transparency is not a solution on its own, however. Governments, as well as donors in the international community, must support civil society organizations, journalists, whistleblowers, and other anticorruption actors.
Link international assistance to anticorruption
The international community has a critical role in ensuring that African countries receive investment to develop their minerals and establish supply and value chains. Donors should acknowledge strong government efforts to tackle corruption with enhanced assistance.
Disable kleptocracy
Some transition minerals originate in countries where the political leadership systematically misappropriates the nation’s resources, to benefit a small group of elites rather than the wider population. When engaging in such kleptocratic contexts, companies and the international community should assess whether their activities enable or strengthen kleptocracy, discontinue those which do, and disclose these assessments and the chosen responses.
African officials and civil society actors have made clear that mining must change to benefit Africans in mineral-rich countries. Meeting African demands is in the interest of energy transition industries and humanity more broadly.
3. A win for the environment and communities

Protect forests, water sources and biodiverse areas from the forthcoming surge in mining
Mining damage might increase as the energy transition progresses
Poorly practiced mining is environmentally destructive, threatens local communities and jeopardizes the planet-wide benefits of the energy transition. The collapse of a South African tailings dam in September 2022 swept away houses, polluted rivers and damaged thousands of hectares of farmland; this is just one recent example of the damage mining can cause.101 Mining indirectly causes seven percent of global deforestation,102 and contributes 10 percent of global emissions.103
Mining’s impact on the environment could worsen.104 The surge in demand for metals could encourage more activity in particularly environmentally sensitive areas. For example, the spike in coltan prices in 2002 led to a rush of mining in Kahuzi-Biega National Park in eastern DRC. IEA analysis suggests that the life-cycle emissions of clean energy are still significantly lower than for fossil fuel technologies, but future production will involve more energy- intensive processes.105 New discoveries are revealing deposits with lower ore grades, which require more extraction, and thus more emissions, to unearth the same quantity of minerals. The mining of many transition minerals requires particularly high water use, and some transition minerals, such as hard-rock lithium (Africa’s likely primary source of lithium), carry particularly high contamination risks.106 The start of lithium mining in countries such as Mali and Namibia could therefore exacerbate increasingly frequent droughts.107
Knowledge on how to protect the environment has improved, but practice is weak
Many governments now require mining companies to produce environmental and social impact assessments (ESIAs) and resulting environmental management plans (EMPs).108 These procedures have sometimes reduced the risk of environmental harm, however, their design and use are often problematic. Environmental risk from a mine can be so severe that even with a rigorous EMP, the expected damage outweighs any benefits that the project could generate for the country. But such mines often proceed nevertheless.
There are a range of solutions. One is setting no-go zones for exploration. (See also page 11.) Few governments exert control over company exploration, despite laws often providing them with the authority to do so.109 Several African governments have issued exploration licenses in environmental protection zones, some of which do not sufficiently cover areas of environmental importance, including large tracts of intact forest in the Congo Basin.110 Once a company discovers a deposit, authorities have difficulty stopping exploitation of the mineral because of powerful financial incentives and corruption. But in some cases, exploration licenses provide companies with the legal right to mine following discovery. In some cases, companies sue governments that withhold a mining license after discovery, even if this is due to environmental risk.111
Governments could improve their licensing decisions by incorporating environmental factors into their economic modeling, but this rarely happens.112
Generally, different governmental authorities are responsible for assessing environmental risks and the economic viability and benefits of a project, with little cooperation between them. Furthermore, authorities often allow mining companies to choose a method of measuring anticipated environmental damage, and sometimes waive the requirement for quantitative measures entirely, making assessments difficult to use in models. Authorities should in these cases consider existing guidance on good practice from the International Finance Corporation and IGF.113
Even with strong valuation tools, host governments often undervalue the environment. Officials often feel pressure to prioritize short- term revenues and jobs. Initiatives like the Central African Forestry Initiative to provide financing to Gabon to maintain its forests would change this calculus.114 Governments publishing clear criteria for investors on what constitutes unacceptable environmental risk would also help.
Having decided to extract, governments also often struggle to prevent risks from materializing. Hiring and equipping skilled staff is difficult.115 As companies use their own methods to measure damage, governments struggle to ensure that companies comply with regulatory benchmarks. Rapidly evolving mining technology and changing ecological understanding of environmental damage make it difficult for governments to protect the environment. Government efforts to increase environmental protection over time are often constrained by mining contracts, many of which still stabilize environmental provisions contrary to advice from the Organization for Economic Co-operation and Development and the United Nations.116
Regarding emissions from mining activities, governments may find carbon taxes a useful tool for incentivizing mining companies to reduce the greenhouse gases they produce. Many governments would need to strengthen their administrative capacities before carbon taxes are feasible, and stabilization clauses in mining contracts may also prevent their introduction. In the meantime, governments and the international community have some options for facilitating emissions reductions in the meantime. For example, while some companies are already turning to renewables to power their mines, they could increase support to expanding renewable energy systems in mining countries to further accelerate this shift.117
Local communities’ voices are currently constrained
Communities within forests and other vulnerable areas have a critical role in protecting the environment directly, as recognized at COP26.118 For example, various studies have shown that deforestation is lower in areas managed by Indigenous peoples given their experience of, and interest in, sustaining it for their livelihoods and future generations.119 Community management of land is also often more cost- effective than government and company schemes. Nevertheless, the international community provides little climate finance to support this practice.120
Given that environmental damage severely affects local communities, companies and governments must allow community members to participate in the decision to extract. In principle, governments and companies have increasingly recognized the need for “free prior and informed consent” from communities before allowing extraction.
However, this engagement is often meaningless. A recent survey of 26 African countries found that seven do not require public consultation until after companies have completed a draft ESIA, rather than during the drafting process.121 Even when companies do consult communities, they are rarely required to take local views into account.
Communities face similar challenges in monitoring the implementation of EMPs. While there are exceptions such as Ghana and Guinea, governments in many African countries do not systematically disclose these documents. African governments could learn from Latin America, where several countries have introduced participatory environmental monitoring committees—though such practices can only achieve so much without addressing the growing government hostility toward and violence against environmental defenders and community leaders.122 123
Figure 9. ESIA disclosures in law and in practice in African mining countries124
Conclusion
Africa’s mineral wealth is essential for the energy transition and for the hundreds of millions of people currently living in poverty in African mining countries. Whether and how governments and companies move to further extract this mineral wealth is not only economically and environmentally important for Africa, but also for the vital importance of protecting the world’s rapidly diminishing forests.
Everyone therefore has an interest in mining governance. We all need a triple- win in mining. But governments and companies have a generally poor track record in governance of the sector.
Few citizens in mining countries have benefited as much as they should have, corrupt actors have gotten away with ill-gotten riches, and investors remain reluctant to invest in some parts of Africa.
Some efforts by governments and development partners have helped to improve governance but given the possibility that African citizens could miss out on the next mining boom—and the need to supply an energy transition— these efforts must be both expanded and accelerated. With so much hanging in the balance, officials and executives cannot repeat past mistakes.
This report has highlighted some of the most promising approaches for obtaining a triple-win.
Developing downstream industries within e-mobility, battery storage value and indeed many other value chains; and developing a competitive supplier base within Africa would both benefit Africans and facilitate the energy transition. Improving how governments collect and manage tax payments from mining companies remains critical, both to fund programs to alleviate poverty and diversify economies dangerously dependent on the volatile mining sector.
Furthermore, authorities won’t achieve a triple win until they establish and maintain no-go zones for mining and better resource environmental protection agencies. Companies must do their part and uphold the highest standards of environmental protection. Finally, none of these policies will succeed unless governments and companies are more transparent, held to account and stop corruption among their ranks.
Governments of countries responsible for two-thirds of the world economy aim reach net-zero emissions by 2050—28 years from now. But climate donors, development partners, companies, and governments have much less time to improve mining governance. Proceeding from the recommendations here, all parties must immediately engage in this vital task.
Acknowledgments
Internal contributors and reviewers:
Lee Bailey, William Davies, Susannah Fitzgerald, Gabriela Flores, Andrea Furnaro, Patrick Heller, Phesheya Nxumalo, Matthieu Salomon, Amir Shafaie.
External contributors and reviewers:
Jerry Adhajie (ANRC), Kwasi Ampofo (BNEF), Jeff Geipel (Mining Shared Value), Richard Goode (independent), Paul Jourdan (independent), Amir Lebdioui (School of Oriental & Africa Studies, London School of Economics), Brendan Schwartz (IIED) and John Sloan (UNECA).
Notes
-
1
International Energy Agency, The Role of Critical Minerals in Clean Energy Transitions (2021), www.iea.org/reports/the-role-of-critical-minerals-in-clean-energy-transitions.
-
2
In this report we refer to both Africa north and south of the Sahara. When we mean one of the sub-regions we specify as such.
-
3
IEA (2021); Clyde Russell, “Mining is key to energy transition, but it’s still unloved,” Reuters, 11 May 2022, www.reuters.com/business/energy/mining-is-key-energy-transition-its-still-unloved-russell-2022-05-11; Jairo Yunis and Elmira Aliakbari, Annual Survey of Mining Companies 2020 (Fraser Institute, 2021), www.fraserinstitute. org/studies/annual-survey-of-mining-companies-2020.
-
4
See, for example, Natural Resource Governance Institute, Natural Resource Charter 2nd edition (2014), resourcegovernance.org/approach/natural-resource-charter.
-
5
Natural Resource Governance Institute, Resource Governance Index: From Legal Reform to Implementation in Sub-Saharan Africa (2018), resourcegovernance.org/sites/default/files/documents/rgi-from-legal-reform-to-implementation-sub-saharan-africa.pdf.
-
6
Africa Climate Foundation, Geopolitics of Critical Minerals in Renewable Energy Supply Chains (2022), africanclimatefoundation.org/news_and_analysis/geopolitics-of-critical-minerals-in-renewable-energy-supply-chains/.
-
7
See for example, Cooper Inveen, “Atlantic Lithium’s Ghana mine poised to being production by 2024,” Reuters, 20 September 2022, www.reuters.com/article/ghana-mining-lithium/atlantic-lithiums-ghana-mine-poised-to-begin-production-by-2024-idUSKBN2QV0NQ?utm_source=substack&utm_me….
-
8
As demonstrated by recent discussions between a U.S.-led group of rich countries and mineral producers such as the Democratic Republic of Congo, Namibia and Tanzania. Julian Pecquet, “US looks to Africa to
diversify supply chain for critical minerals,” The Africa Report, 23 September 2022. www.theafricareport.com/243847/us-looks-to-africa-to-diversify-supply-chain-for-critical-minerals. -
9
Glada Llahn and Paul Stevens, The curse of the one-size-fits-all fix, UNU-WIDER Working Paper (United Nations University, 2017), www.wider.unu.edu/sites/default/files/wp2017-21.pdf. For further assessment of donors’ activities in the past, both positive and negative lessons, see: Joanna Buckley, Neil McCulloch and Nick Travis, Donor-supported approaches to improving extractives governance, UNU-WIDER Working Paper (United Nations University, 2017), www.wider.unu.edu/sites/default/files/wp2017-33.pdf; Siân Herbert and Laura Bolton, Donor activity in the extractives sector (Knowledge, evidence and learning for development, 2018), opendocs.ids.ac.uk/opendocs/bitstream/handle/20.500.12413/13589/Donor_activity_in_the_extractives_sector.pdf.
-
10
Although this estimate includes emissions resulting from the investments by each group. Lucas Chancel, “Global carbon inequality over 1990–2019,” Nature Sustainability (2022), doi. org/10.1038/s41893-022-00955-z.
-
11
For Further reading on this dilemma and the arguments between the proponents of “green growth” and “degrowth, see: Alex Bowen and Samuel Fankhauser, “The Green Growth Narrative: Paradigm Shift or Just Spin? Global Environmental Change-human and Policy Dimensions,” Global Environmental Change, 21 (2021), 1157-1159, DOI: I:10.1016/j. gloenvcha.2011.07.007; Kate Raworth, Doughnut Economics: Seven Ways to Think Like a 21st Century Economist, Random House Business Books, London, 2017; Jason Hickel, “What does degrowth mean? A few points of clarification,” Globalizations, 18:7 (2021), 1105-1111, DOI: 10.1080/14747731.2020.1812222.
-
12
McKinsey & Company, “The raw-materials challenges: How the metals and mining sector will be at the core of enabling the energy transition” (2022), www.mckinsey. com/industries/metals-and-mining/our-insights/the-raw-materials-challenge-how-the-metals-and-mining-sector-will-be-at-the-core-of-enabling-the-energy-transition.
-
13
McKinsey & Company, “Metal mining constraints on the electric mobility horizon” (2018), www.mckinsey.com/industries/oil-and-gas/our-insights/metal-mining-constraints-on-the-electric-mobility-horizon.
-
14
McKinsey (2018)
-
15
NRGI analysis, based on Net Zero Tracker. “Net Zero Tracker,” Energy and Climate Intelligence Unit, Data-Driven EnviroLab, NewClimate Institute, Oxford Net Zero (2022), zerotracker.net
-
16
Pratima Desai, “Low carbon world needs $1.7 trillion in mining investment,” Reuters, 10 May 2021, www.reuters.com/business/energy/low-carbon-world-needs-17-trillion-mining-investment-2021-05-10/
-
17
Based on S&P Global Market Intelligence data and U.S. Geological Survey, Mineral Commodity Summaries 2022, 2022, www.pubs.er.usgs.gov/publication/mcs2022. These sources sometimes differ significantly. An average is taken when the reported amounts are similar. When they are not, a third source is used to determine which is likely to be more accurate.
-
18
NRGI analysis based on reserves reported in the S&P Globaldatabase and U.S. Geological Survey (2022), and the mineral volumes in a standard electric vehicle in IEA (2021).
-
19
See for example, World Bank, “New World Bank Survey Brings Hope to Malawi’s Mineral Potential,” 22 September 2015, www.worldbank.org/en/news/feature/2015/09/22/new-world-bank-survey-brings-hope-to-malawis-mineral-potential.
-
20
International Energy Agency, Global Supply Chains of EV Batteries (2022), www.iea.org/reports/global-supply-chains-of-ev-batteries.
-
21
African Minerals Development Centre (AMDC), “Unveiled: The #AMDC’s Theory of Change: A prosperous and transformed Africa achieved through sustainable development of mineral and energy resources...” Twitter post (11 October 2022), www.twitter.com/AfricanAmdc/status/1579789353584164864.
-
22
Based on S&P Global data and U.S. Geological Survey (2022). These sources sometimes differ significantly. An average is taken when the reported amounts are similar. When they are not, a third source is used to determine which is likely to be more accurate.
-
23
The correlation between exploration and mineral reserves per square kilometer is 0.79. The figure compares exploration for all metals except gold from 2002 to 2021 with current value of transition mineral reserves. Exploration spend, reserves and prices from S&P Global Market Intelligence; land area data from www.worldpopulationreview.com.
-
24
The correlation between the Resource Governance Index and Policy Potential Index scores is 0.5. The NRGI Resource Governance Index measures the transparency and accountability of mining institutions. The Policy Potential Index (PPI) in the Fraser Institute survey shows the attractiveness of a country’s policies to investors. The PPI score reported in the figure is an average of the scores from 2017 to 2021 where available, and average across jurisdictions for countries that have several. Some countries have low survey response rates, between 5 to 9 respondents. Natural Resource Governance Institute, “Resource Governance Index 2017,” 2017, resourcegovernanceindex.org; Yunis and Aliakbari (2021).
-
25
African Minerals Development Centre, Desktop Review of African Geological Survey Organisation Capacities and Gaps (United Nations Economic Commission for Africa, 2018), archive.uneca.org/publications/desktop-review-african-geological-survey-organisation-capacities-and-gaps.
-
26
Antony Sguazzin, “South Africa Sets 900 Million Annual Mineral Exploration Target,” Bloomberg, 12 April 2022, www.bloomberg.com/news/articles/2022-04-12/s-africa-sets-900-million-annual-mineral-exploration-target.
-
27
Oil exploration investment is known to correlated strongly with the quality of governance in a country, and it seems likely that a similar pattern holds for mineral exploration. See James Cust and Harding Torfinn, “Institutions and the Location of Oil Exploration”, Journal of the European Economic Association (2019).
-
28
Richard Schodde, “Key issues affecting the time delay between discovery and development – is it getting harder and longer?” PDAC 2014, 3 March 2014, Toronto. minexconsulting.com/wp-content/uploads/2019/04/Schodde-presentation-to-PDAC-March-2014.pdf
-
29
Summary of five studies. The outlier is the McKinsey study (7 to 10 years), but this was based on “large-scale greenfield assets” only. Like findings of Schodde (2021), which highlights that large projects are quicker. McKinsey (2022); IEA (2021); Tehmina Khan, Trang Nguyen, Franziska Ohnsorge, and Richard Schodde, “From Commodity Discovery to Production,” Policy Research Working Paper (World Bank, 2016); Paul Manalo, “Top mines average time from discovery to production: 16.9 years,” Metals and Mining Research S&P Global Market Intelligence (2020); Schodde (2014).
-
30
IEA (2021)
-
31
Schodde (2021) and Khan et al. (2016)
-
32
David Humphreys, “The mining industry and the supply of critical minerals,” Critical Minerals Handbook, Gus Gunn (ed.), chapter 2, 2013.
-
33
Khan et al. (2016)
-
34
Several of the experts interviewed for this report suggested that this is the main opportunity for shortening lead times.
-
35
David Manley, Patrick R.P. Heller and William Davis, No Time to Waste: Governing Cobalt Amid the Energy Transition (Natural Resource Governance Institute, 2022), resourcegovernance.org/no-time-to-waste-governing-cobalt-amid-energy-transition.
-
36
Matt Renaud and Mustafa Kumral, “Out of the Comfort Zone: Quantifying Country Risk for Foreign Mining Project Investment Feasibilities,” Mining, Metallurgy & Exploration, 38, 2323-2335 (2021), www.doi.org/10.1007/s42461-021-00495-8.
-
37
Based on S&P Global data and U.S. Geological Survey (2022). These sources sometimes differ significantly. An average is taken when the reported amounts are similar. When they are not, a third source is used to determine which is likely to be more accurate.
-
38
Henry Sanderson, “Vedanta starts arbitration against Zambia after mines seized,“ Financial Times, 31 May 2019. www.ft.com/content/98b0c464-83a1-11e9-b592-5fe435b57a3b.
-
39
Julia Tilley, “Labour talks 217: Escondida and other stories,” S&P Global Market Intelligence, Metals and Mining Research, 23 February 2017.
-
40
Keval Dhokia, “Global copper pipeline challenged due to disruption,” S&P Global Market Intelligence, Metals and Mining Research, 18 June 2019.
-
41
Sudarshan Varadhan, “Indian state seeks permanent closure of Vedanta’s copper smelter: officials,” Reuters, 24 May 2018. www.reuters.com/article/us-vedanta-smelter-idUSKCN1IP1CX.
-
42
Dhokia (2019)
-
43
Misha Savic, Jan Bratanic and Thomas Biesheuvel, “Europe’s Biggest Lithium Mine Blocked as Rio Loses in Serbia,” Bloomberg, 20 January 2022, www.bloomberg.com/news/articles/2022-01-20/serbia-suspends-rio-tinto-s-2-4-billion-lithium-mine-project.
-
44
Tanzania Minerals Audit Agency, A Study on Viability to Construct a Copper Concentrate Smelter in Tanzania (2011), www.scribd.com/document/193187016/A-Study-on-Viability-to-Construct-a-Copper-Concentrate-Smelter-in-Tanzania1.
-
45
Africa Confidential, “Local processing row holds up rare earth mine,” 25 October 2022, www.africa-confidential.com/article-preview/id/14166/Local_processing_row_holds_up_rare_earth_mine.
-
46
Reuters, “Timeline: The battle for Simandou,” 22 January 2021, www.reuters.com/article/us-swiss-steinmetz-timeline-idUSKBN29R2AA.
-
47
Magnus Ericsson and Olof Löf, “Mining’s contribution to national economies between 1996 and 2016,” Mineral Economics, 223–250 (2019), doi.org/10.1007/s13563-019-00191-6.
-
48
Net savings plus education expenditure and minus energy depletion, mineral depletion, net forest depletion, and carbon dioxide and particulate emissions damage. NRGI analysis of World Bank, “World Development Indicators,” accessed 28 September 2022, www.databank.worldbank.org/source/world-development-indicators.
-
49
Anthony J. Venables, “Using Natural Resources for Development: Why Has It Proven So Difficult?” Journal of Economic Perspectives, 30:1, 161–184 (2016) doi. org/10.1257/jep.30.1.161.
-
50
Giorgia Albertin, Boriana Yontcheva, Dan Devlin, Hilary Devine, Marc Gerard, Sebastian Beer, Irena Jankulov Suljagic and Vimal V. Thakoor, Tax Avoidance in Sub-Saharan Africa’s Mining Sector, Departmental Paper No 2021/022 (International Monetary Fund, 2021), www.imf.org/en/Publications/Departmental-Papers-Policy-Papers/Issues/2021/09/27/Tax-Avoidance-in-Sub-Saharan-Africas-Mining-Sector-464850
-
51
See for example, South African Human Rights Commission, National Hearing on the Underlying Socio-economic Challenges of Mining-affected Communities in South Africa (2016), www.sahrc.org.za/home/21/files/SAHRC%20Mining%20communities%20report%20FINAL.pdf
-
52
See, for example, Claude Kabemba, “How mineral resources can fuel the development of Africa in the context of post-Covid economic recovery,” Publish What You Pay Annual Conference, 14-15 March 2021, www.sarwatch.co.za/how-mineral-resources-can-fuel-the-development-of-africa-in-the-context-of-post-covid-economic-recovery.
-
53
See, for example, African Development Bank, Request for Expressions of Interest, 2022, www.afdb.org/sites/default/files/reoi_green_minerals_strategy_approach_paper_002.pdf.
-
54
Other partners currently include African Legal Support Facility, Africa Finance Corporation, Afreximbank, United Nations Economic Commission for Africa and United Nations Development Programme.
-
55
African Development Bank, “Why Africa is the next renewables powerhouse,” 7 December 2018, www.afdb.org/en/news-and-events/why-africa-is-the-next-renewables-powerhouse-18822
-
56
Manley et al (2022)
-
57
Through Power Africa (www.usaid.gov/powerafrica), for example.
-
58
Reserves data is from S&P Global Market Intelligence and U.S. Geological Survey. The above ground assets of a country comprise its power and transport infrastructure, human capital and other productive capabilities, level of environmental protection and investment climate. They have been converted to a regional index of 0-100.
The data is from multiple sources: African Development Bank, The Africa Infrastructure Development Index (AIDI) 2020, 2020, www.afdb.org/en/documents/economic-brief-africa-infrastructure-development-index-aidi-2020-july-2020; World Bank, “World Development Indicators”; African Development Bank, Electricity Regulatory Index (ERI) for Africa, 2021, 2021, africa-energy-portal.org/reports/electricity-regulatory-index-eri-africa-2021-edition; World Intellectual Property Organization, Global Innovation Index (GII) 2021, 2021, www.wipo.int/publications/en/details.jsp?id=4560; Harvard Growth Lab, “The Atlas of Economic Complexity,” accessed 20 September 2022, www.atlas.cid.harvard.edu/; Environmental Protection Index, “2022 Environmental Protection Index (2022),” accessed 20 September 2022, www.epi.yale.edu/; World Bank, “Doing Business 2020,” accessed 20 September 2022, www.worldbank.org/en/programs/business-enabling-environment/doing-business-legacy; S&P Global, “Control Risks Country Risk Summary,” accessed 20 September 2022, www.capitaliq.spglobal.com. -
59
Southern African Development Community and African Minerals Development Centre, Developing a Regional Mining Vision for the Southern African Development Community (SADC), 2018.
-
60
Manley et al (2022)
-
61
Emily Hersh, Alex Grant and Chris Berry, So, You Want to make Batteries Too? (Payne Institute, 2020), www.payneinstitute.mines.edu/so-you-want-to-make-batteries-better-too
-
62
Ibid.
-
63
See for example, African Development Bank, Lithium-Cobalt Value Chain Analysis for Mineral Based Industrialization in Africa (2021), www.afdb.org/en/documents/lithium-cobalt-value-chain-analysis-mineral-based-industrialization-Africa.
-
64
McKinsey & Company, Power to move: Accelerating the electric transport transition in sub-Saharan Africa (2022), www.mckinsey.com/industries/automotive-and-assembly/our-insights/power-to-move-accelerating-the-electric-transport-transition-in-sub- aharan-africa.
-
65
BloombergNEF, The Cost of Producing Battery Precursors in the DRC (2021), about. bnef.com/blog/producing-battery-materials-in-the-drc-could-lower-supply-chain-emissions-and-add-value-to-the-countrys-cobalt.
-
66
Mohua Mukherjee, India’s Mass-Market Clean Mobility Initiatives and its Unique, Customized Business Models for Light Electric Vehicles (The Oxford Institute for Energy Studies, 2022), www.oxfordenergy.org/publications/indias-mass-market-clean-mobility-initiatives-and-its-unique-customized-business-models-for-light-electric-vehicles.
-
67
Rwanda Ministry of Infrastructure, Strategic Paper on Electric Mobility Adaption in Rwanda (2021), www.mininfra.gov.rw/fileadmin/user_upload/Mininfra/Publications/Laws_Orders_and_Instructions/Transport/16062021_Strategic_Paper_for_e-mobility_adapta….
-
68
Manley et al (2022)
-
69
IEA (2022)
-
70
See for example World Gold Council, Responsible gold mining and value distribution, 2013 report (2013), www.gold.org/goldhub/research/responsible-gold-mining-and-value-distribution-2013-report.
-
71
World Gold Council (2013). Mining Shared Value has indicated these figures are representative of wider sector trends.
-
72
Jeff Geipel, Mining Shared Value, interview with authors, 25 September 2022.
-
73
Government of Canada, “Minerals Sector Employment,” January 2019, www.nrcan.gc.ca/science-data/science-research/earth-sciences/earth-sciences-resources/earth-sciences-federal-programs/minerals-sector-employment/16739; Mets Ignited, “METS in Australia,” accessed 28 September 2022, www.metsignited.org/australian-mets-sector/.
-
74
Aaron Cosbey and Isabelle Ramdoo, Guidance for Governments: Local Content Policies (Intergovernmental Forum on Mining, Minerals, Metals and Sustainable Development, 2018), igf-guidance-for-governments-local-content.pdf; International Finance Corporation, Guide to Getting Started in Local Procurement (2011), www.ifc.org/wps/wcm/connect/topics_ext_content/ifc_external_corporate_site/sustainability-at-ifc/publications/publications_handbook_guidetogettingsta…; Mining Shared Value and Engineers Without Borders, The Mining Local Procurement Reporting Mechanism (LPRM) (2017), www.miningsharedvalue.org/mininglprm.
-
75
See for example, activities of the Industrial Development Corporation (www.idc.co.za) and Anglo American’s Zimele programs (www.southafrica.angloamerican.com/our-difference/zimele)
-
76
Southern Africa Resource Watch, From Harmonisation of Policies to the Manufacturing of Lithium Batteries in Southern Africa: Collaboration between DRC and Zambia (2022), www.sarwatch.co.za/publication/from-harmonisation-of-policies-to-the-manufacturing-of-lithium-batteries-in-southern-africa-collaboration-between-drc-….
-
77
Jeff Geipel, Mining Shared Value, interview with authors, 25 September 2022.
-
78
Giorgia Albertin et al (2021). Note that the definition of mineral-dependent does not overlap with which countries have substantial reserves of transition minerals.
-
79
Ibid. The IMF estimates the 15 mineral-rich countries earned mining revenues equals 2 percent of GDP on average. This amounts to $13 billion a year.
-
80
For example, if companies were to adhere to more responsible tax practices such as the B Team Responsible Tax Principles. See The B Team, “Advancing Responsible Tax Practice,” accessed 28 September 2022, www.bteam.org/our-work/causes/governance/advancing-responsible-tax-practice.
-
81
Yannick Bouterige, Céline de Quatrebarbes and Bertrand Laporte, Mining Taxation in Africa: What Evolution in 2018? (International Centre for Tax and Development, 2020), www.ictd.ac/publication/mining-taxation-africa-recent-evolution.
-
82
Giorgia Albertin et al (2021).
-
83
For example, a study of contracts on resourcecontracts.org revealed that Burkina Faso, Burundi, Guinea, Madagascar and Mali had agreed stabilization clauses lasting 30- 34 years on average—significantly longer than necessary to ensure the bankability of projects. Intergovernmental Forum on Mining, Minerals, Metals and Sustainable Development, Insights on Incentives: Tax Competition in Mining (2019), www.iisd.org/sites/default/files/publications/insights-incentives-tax-competition-mining.pdf; Natural Resource Governance Institute, resourcecontracts.org.
-
84
NRGI analysis using S&P Global mineral reserves and price data. Prices are near-term forecasts and therefore may be elevated compared to the longer-term trend.
-
85
NRGI analysis. On average, 16 percent of mining sales revenue has gone to tax payments. See Robert Pitman and Kaisa Toroskainen, Beneath the surface: The Case for Oversight of Extractive Industry Suppliers (Natural Resource Governance Institute, 2020) resourcegovernance.org/analysis-tools/publications/beneath-surface-oversight-extractive-industry-suppliers.
This figure aligns with estimates in other studies: Olle Östensson, Local content, supply chains, and shared infrastructure, UNU-WIDER Working Paper (United Nations University, 2017), www.researchgate.net/publication/337699966_Local_content_supply_chains_and_shared_infrastructure; Price Waterhouse Coopers, Total Tax Contribution: A study of the economic contribution mining companies make to public finances (2010), www.pwc.co.uk/assets/pdf/ttc-mining-study-1.pdf. -
86
Anthony J. Venables (2016) and Natural Resource Governance Institute (2014).
-
87
NRGI (2017), “Resource Governance Index 2017.” There was a small improvement in a smaller sample of countries covered by the 2021 edition of the Resource Governance Institute.
-
88
Anna Fleming, Thomas Lassourd and David Manley, “Variable Royalties: an Answer to Volatile Mineral Prices?” in Handbook on the Future of Resource Taxation, African Tax Administration Forum and Intergovernmental Forum on Mining, Minerals, Metals and Sustainable Development (forthcoming),www.iisd.org/publications/brief/future-resource-taxation-roadmap.
-
89
Robert Pitman, “Contract Disclosure Policy and Practice Tracker,” accessed 15 October 2022, docs.google.com/spreadsheets/d/1FXEeD43jw6VYHV8yS-8KJ5-rR5l0XtKxVQZBWzr-ohY.
-
90
Based on membership of the Extractive Industries Transparency Initiative (www.eiti.org/countries).
-
91
Natural Resource Governance Institute, “Chile country profile,” accessed 5 October 2022, www.resourcegovernanceindex.org/country-profiles/CHL/mining.
-
92
Transparency International, “Corruption Perceptions Index 2021,” www.transparency.org/en/cpi/2021.
-
93
United Nations Office on Drugs and Crime, Corruption and Sustainable Development (no date), www.anticorruptionday.org/documents/actagainstcorruption/print/corr18_fs_DEVELOPMENT_en.pdf
-
94
K.C. Michaels, Louis Maréchal and Benjamin Katz, “Why is ESG so important to critical mineral supplies, and what can we do about it?” (International Energy Agency, 2022) www.iea.org/commentaries/why-is-esg-so-important-to-critical-mineral-supplies-and-what-can-we-do-about-it
-
95
Extractive Industries Transparency Initiative, Making the grade: Strengthening governance of critical minerals, www.eiti.org/documents/strengthening-governance-critical-minerals.
-
96
Extractive Industries Transparency Initiative, EITI Standard 2019, eiti.org/collections/ eiti-standard#EITI-Requirements-2019; Organisation for Economic Co-operation and Development, OECD Due Diligence Guidance for Responsible Supply Chains of Minerals from Conflict-Affected and High-Risk Areas (2016), www.oecd.org/daf/inv/mne/OECD-Due-Diligence-Guidance-Minerals-Edition3.pdf; Alexandra Gillies, Sebastian Sahla, Matthieu Salomon and Tom Shipley, Diagnosing Corruption in the Extractive Sector: A Tool for Research and Action (Natural Resource Governance Institute, 2021) www.resourcegovernance.org/analysis-tools/publications/diagnosing-corruption-extractive-sector-tool-research-and-actionrespectively.
-
97
Colombia National Mining Agency, Management and Corruption Risk Matrices of the ANM approved by the Institutional Management
and Performance Committee on 01/27/2022 (2022), www.anm.gov.co/?q=documentos_para_comentarios_ciudadania; Robert Pitman and Kaisa Toroskainen, “BHP, Others Increase Scrutiny of Subcontracting Corruption Risks” (Natural Resource Governance Institute, 2018) www.resourcegovernance.org/blog/bhp-others-increase-scrutiny-subcontracting-corruption-risks. -
98
Alexandra Gillies, “Will Extractive Companies Move Away from Corruption- Prone Intermediaries?”, (Natural Resource Governance Institute, 2019) www.resourcegovernance.org/blog/extractive-companies-corruption-intermediaries-middlemen-oil.
-
99
Natural Resource Governance Institute, Anticorruption Guidance for Partners of State-Owned Enterprises (2022), soe-anticorruption.resourcegovernance.org/chapters/avoiding-high-risk-agents
-
100
Favour Ime and Louise Russell-Prywata, “Beneficial ownership transparency and the fight against grand corruption in Nigeria” (Open Ownership, 2022), www.openownership.org/en/blog/beneficial-ownership-transparency-and-the-fight-against-grand-corruption-in-nigeria.
-
101
Nqobile Dludla, “South Africa mine dam wall collapses, Killing 1 and injuring 40,” Reuters, 11 September 2022, www.reuters.com/world/africa/south-africa-mine-dam-wall-collapses-killing-three-injuring-40-2022-09-11.
-
102
Kirsten Hund and Erik Reed, “A low-carbon future must protect the world’s forests” (World Bank, 2019), www.blogs.worldbank.org/voices/low-carbon-future-must-protect-worlds-forests.
-
103
NRGIcalculationsusingscope1,2and3 emissions (excluding fugitive methane and emissions from the combustion of coal) reported by Lindsay Delevingne, Will Glazener, Liesbet Grégoir and Kimberly Henderson, “Climate risk and decarbonisation: What every mining CEO needs to know,” McKinsey & Company, 2020 www.mckinsey.com/business-functions/sustainability/our-insights/climate-risk-and-decarbonization-what-every-mining-ceo-needs-to-know. Total global emissions are for 2019 from Climate Watch, “Global Historical Emissions,” accessed 18 September 2022, www.climatewatchdata.org/ghg-emissions?end_year=2019&start_year=1990.
-
104
See for example, Éléonore Lèbre, Martin Stringer, Kamila Svobodova, John R. Owen, Deanna Kemp, Claire Côte, Andrea Arratia-Solar and Rick K. Valenta, “The social and environmental complexities of extracting energy transition metals,” Nature Communications, 11: 4823 (2020), www.nature.com/articles/s41467-020-18661-9#MOESM1.
-
105
IEA (2021)
-
106
Ibid.
-
107
World Bank, “Climate Change Knowledge Portal,” accessed 28 September 2022, www.climateknowledgeportal.worldbank.org.
-
108
NRGI (2017)
-
109
Cameroon is one exception, with its new cadastre system preventing licenses being granted that overlap protected areas. Several companies also have a no-go policy, though only for World Heritage sites. See for example ICMM, “ICMM calls for stronger legal protection of World Heritage Sites,” 2016, www.icmm.com/en-gb/news/2016/icmm-calls-for-protection-of-world-heritage-sites.
-
110
Abbi Buxton, People and nature first: safeguards needed in mining exploration (International Institute for Environment and Development, 2021) www.iied.org/20736iied.
-
111
See for example in Colombia: Lorenzo Cotula, Investment disputes from below: whose rights matter? (International Institute for Environment and Development, 2020), www.iied.org/investment-disputes-below-whose-rights-matter.
-
112
Nicola Woodroffe and Tim Grice, Beyond Revenues: Measuring and Valuing Environmental and Social Impacts in Extractive Sector Governance (Natural Resource Governance Institute, 2019), www.resourcegovernance.org/analysis-tools/publications/beyond-revenues-measuring-environmental-social-impacts.
-
113
IFC, E&S Performance Standards (2012), www.ifc.org/wps/wcm/connect/topics_ext_content/ifc_external_corporate_site/sustainability-at-ifc/policies-standards/performance-standards; IGF, Environmental and Social Impact Assessments (2020), www.igfmining.org/our-work/environmental-and-social-impact-assessments.
-
114
Daniel Whyte, “Forest finance: how Gabon earned the first payment for conservation in Africa,” Climate Tracker, 8 December 2021, www.climatetracker.org/forest-protection-first-payment-gabon-africa.
-
115
See for example Taako Edema George, Kiemo Karatu, and Andama Edward, “An evaluation of the environmental impact assessment practice in Uganda: challenges and opportunities for achieving sustainable development,” Heliyon 6(9), 2020, www.ncbi.nlm.nih.gov/pmc/articles/PMC7505666.
-
116
See for example Organisation for Economic Co-operation and Development, Guiding Principles for Durable Extractive Contracts (2019), www.oecd.org/dev/Guiding_Principles_for_durable_ extractive_contracts.pdf; United Nations Human Rights Office
of the High Commissioner, Principles for Responsible Contracts: Integrating the Management of Human Rights Risks into State-Investor Contract Negotiations- Guidance for Negotiators (2015), www.ohchr.org/%20Documents/Publications/Principles_ResponsibleContracts_HR_PUB_15_1_EN.pdf; and NRGI (2014). -
117
See for example Reuters, “South Africa’s Gold Fields bets on solar to cut costs and carbon,” 13 October 2022, www.reuters.com/business/sustainable-business/south-africas-gold-fields-bets-solar-cut-costs-carbon-2022-10-13.
-
118
U.N. Climate Change Conference UK 2021, “Glasgow Leaders’ Declaration on Forests and Land Use,” 2021, ukcop26.org/glasgow-leaders-declaration-on-forests-and-land-use.
-
119
Frances Seymour, Tony La Vina and Kristen Hite, Evidence linking community-level tenure and forest condition: An annotated bibliography (Climate and Land Use Alliance, 2015), www.climateandlandusealliance.org/wp-content/uploads/2015/08/Community_level_tenure_and_forest_condition_bibliography.pdf.
-
120
Peter G. Veit, “9 Facts about Community Land and Climate Mitigation” (World Resources Institute, 2021) files.wri.org/d8/s3fs-public/2021-10/9-facts-about-community-land-and-climate-mitigation.pdf.
-
121
Development Bank of Southern Africa, African Environmental Assessment Legislation Handbook: Consultation Draft, 2021, www.dbsa.org/african-environmental-assessment-legislation-handbook.
-
122
United Nations Development Programme, Participatory Environmental Monitoring Committees in Mining Contexts, 2019, www.undp.org/publications/participatory-environmental-monitoring-committees-mining-contexts.
-
123
Jonathan Watts, “Murders of environment and land defenders hit record high,” The Guardian, 13 September 2021, www.theguardian.com/environment/2021/sep/13/murders-environment-land-defenders-record-high.
-
124
NRGI (2017), “Resource Governance Index 2017.” There was a small improvement in a smaller sample of countries covered by the 2021 edition of the Resource Governance Institute.
-
125
With a gold price of USD 1,600 per ounce.
-
126
With a low-profit mine and a gold price of $1,600 per ounce.
-
127
Cecilia Jamasmie, “Petra Diamonds’ stake in Williamson to shrink as part of deal with Tanzania,” Mining.com, 13 December 2021, www.mining.com/petra-diamonds-stake-in-williamson-to-shrink-as-part-of-deal-with-tanzania.
-
128
Lifezone Metals, “Kabanga Nickel Signs Framework Agreement,” 19 January 2021, www.lifezonemetals.com/kabanga-nickel-signs-framework-agreement.
-
129
Thomas Scurfield and Silas Olan’g, “Magufuli Seeks the Right Balance for Tanzania’s Mining Fiscal Regime,” NRGI, 31 January 2019, www.resourcegovernance.org/blog/magufuli-seeks-right-balance-tanzania-mining-fiscal; Thomas Scurfield, “Tanzania Strikes a Better Balance with its Mining Fiscal Regime,” NRGI, 24 June 2020, www.resourcegovernance.org/blog/tanzania-strikes-better-balance-mining-fiscal-regime.
-
130
This framework agreement was published in a document setting out Barrick’s offer to buy the shares it did not already own in Acacia Mining, the previous owner of the Bulyanhulu, Buzwagi and North Mara mines in Tanzania. See Acacia Mining and Barrick Gold, Recommended Final Offer for Acacia Mining Plc by Barrick Gold Corporation, 2019, 66–79, s25.q4cdn.com/322814910/files/doc_downloads/acacia/Acacia-2.7-announcement.pdf.
-
131
The main revenue streams are import duty, skills development levy, royalty, corporate income tax, a share of dividends and shareholder loan repayments through state equity, and dividend withholding tax.
-
132
The earlier in time a shilling (Tanzania’s official currency unit) is received, the more it is worth. This is, first, because it can be used earlier; and second, because the future is uncertain, and no one can be sure they will receive that shilling in the future. To account for this time value of money, a “discount rate” is applied. In the sharing arrangement, this would mean that if the government received a shilling in year 1, the company would need to receive more than a shilling in year 2 for the benefits to be comparable. However, given cumulation here is based on actual cash flow, the company would need to receive only a shilling in year 2 for the benefits to be shared equally.
-
133
This provision for the company to earn its minimum return before sharing is triggered means Ecuador’s mechanism is similar to an R-based cash flow tax, commonly referred to as a Brown Tax. See, e.g., Robin Broadway and Michael Keen, “Theoretical perspectives on resource tax design,” in The Taxation of Petroleum and Minerals: Principles, Problems and Practice, edited by Philip Daniel, Michael Keen and Charles McPherson (Oxford: Routledge, 2010), 13–74.
-
134
Prices are taken from World Bank, “Commodities Price Data (The Pink Sheet),” www.worldbank.org/en/research/commodity-markets.
-
135
With a gold price of $1,600 per ounce.
-
136
With a gold price of $1,600 per ounce.
-
137
With a gold price of $1,600 per ounce.
-
138
The Fraser Institute survey estimates that, unless there are extremely harmful policies, around 60 percent of an investment decision tends to be based on a country’s geology. The other 40 percent comprises of several other factors, including political stability and policy predictability (given they affect the risk that investors will not be able to secure future returns generated by their investments), a conducive business environment and the tax level. See Julio Mejia and Elmira Aliakbari, Fraser Institute Annual Survey of Mining Companies 2022, (Fraser Institute, 2023), 8, www.fraserinstitute.org/studies/annual-survey-of-mining-companies-2022.
-
139
However, information gaps make it difficult for taxes to be structured to capture all excess profit. See Jean-Franҫois Wen, Progressive Taxation of Extractive Resources as Second-Best Optimal Policy (International Monetary Fund, 2018), www.imf.org/en/Publications/WP/Issues/2018/06/13/Progressive-Taxation-of-Extractive-Resources-as-Second-Best-Optimal-Policy-45923.
-
140
Recent research provides a sense of the potential revenue loss to governments from tax avoidance. The International Monetary Fund recently estimated that sub-Saharan African mining countries could be losing between $450 and $730 million in corporate income tax a year. See Sebastian Beer and Dan Devlin, Is There Money on the Table? Evidence on the Magnitude of Profit Shifting in the Extractive Industries (International Monetary Fund, 2021), www.imf.org/en/Publications/WP/Issues/2021/01/15/Is-There-Money-on-the-Table-Evidence-on-the-Magnitude-of-Profit-Shifting-in-the-Extractive-49983.
-
141
It is perhaps surprising that Tanzania’s 50-50 sharing arrangement generates an AETR greater than 50 percent (with a discount rate of 10 percent). This is despite AETR measuring government take as the share of pre-tax profits, which is larger than “economic benefits” (given economic benefits exclude interest payments). This outcome results from the 50-50 split being based on actual cash flow. The government receives revenue before the mining company through input and production taxes that do not depend on the mine making a profit. Because of these earlier revenues, the government receives a larger share on a discounted basis.
-
142
As reported in the S&P Global database. Legal risks are “expropriation, state contract alteration and contract enforcement risks.” Tax risks are “tax increase and tax inconsistency risks.” Control Risks scores these risks as still “very high” and “high” respectively (following Tanzania’s overhaul of extractives sector laws and other actions against existing mines in 2017) but reducing.
-
143
With a discount rate of 10 percent. While Ecuador’s sharing mechanism does not account for the labor profit share because none of it will go to the government from 2024 onwards, I have included it in the AETR because it is a tax on the project. The Democratic Republic of Congo regime has an excess profits tax that is triggered for a mine when the realized price is at least 25 percent higher than the price in its feasibility study. I assumed that the feasibility study has a price of $1,300 per ounce, so the excess profits tax is not triggered.
-
144
Total benefits in this case are a project’s revenues minus operating costs and replacement capital (but not minus exploration and development capital). This cash flow represents the money available to pay back the initial investment and provide a return. The government share of it is a common measure of progressivity.
-
145
Wen, Progressive Taxation of Extractive Resources as Second-Best Optimal Policy.
-
146
With a discount rate of 10 percent. The results for only some countries are shown to clearly depict each data point. The results for all the evaluated countries can be found in my model.
-
147
Scurfield, “Tanzania Strikes a Better Balance with its Mining Fiscal Regime.”
-
148
This feature is not fully reflected in Figure 5 given that “total benefits” use a slightly different definition of profits and are based on discounted cash flows.
-
149
With a gold price of $1,600 per ounce.
-
150
For example, an average 62 percent of respondents to the Fraser Institute surveys between 2017 and 2019 said the current implementation of Tanzania’s legal system would strongly discourage investment, and 73 percent said regulatory uncertainty would. See, e.g., Ashley Stedman, Jairo Yunis and Elmira Aliakbari, Fraser Institute Annual Survey of Mining Companies 2019 (Fraser Institute, 2020), www.fraserinstitute.org/studies/annual-survey-of-mining-companies-2019.
-
151
With a low-profit mine and a gold price of $1,600 per ounce.
-
152
Tax avoidance could extend the Philippines’ recovery period, and therefore delay the payment of some taxes including import duty and interest withholding tax, given the end of the recovery period depends on the reported profitability of a mine rather than an ex-ante assessment. However, the rule that the recovery period must end five years from the start of production regardless of whether pre-production expenses have been recouped limits the extent to which it can be extended.
-
153
The merits of these measures require further scrutiny. E.g., taking a share of loan repayments could result in lenders charging a higher interest rate to ensure they still recoup their loan and a minimum return. This would not only reduce taxable income but also make it harder for the government to assess whether an interest rate is reasonable, because it would not be comparable with industry benchmarks. It can also be difficult for a government to always determine whether a loan is from a related party or not. However, these considerations are outside the scope of this analysis.
-
154
Natural Resource Governance Institute (NRGI), Natural Resource Charter, 2nd edition, 2014, resourcegovernance.org/analysis-tools/publications/natural-resource-charter-2nd-ed.
-
155
Although its exclusion of several significant taxes from the government’s share of benefits means low-profit mines may still be impacted.
-
156
With a gold price of $1,600 per ounce.
-
157
Anna Fleming, Thomas Lassourd and David Manley, “Variable Royalties: an Answer to Volatile Mineral Prices?” in Handbook on the Future of Resource Taxation, African Tax Administration Forum and Intergovernmental Forum on Mining, Minerals, Metals and Sustainable Development (forthcoming), www.iisd.org/publications/brief/future-resource-taxation-roadmap.
-
158
Ensuring that interest rates used as a comparison apply to comparable assets with a similar risk profile is challenging, but rules of this nature have been successful in reducing profit shifting in other countries. See Beer and Devlin, Is There Money on the Table?.
-
159
The main taxes listed are VAT, royalty and corporate income tax. The regime also includes a share of pre-tax profits that is currently divided between the company’s workers and the government, with the portion received by the government included in its accumulated benefits. However, a recent court ruling means that all this labor profit share will go to workers from the start of 2024 and therefore none of it will be included in government benefits.
-
160
The discount rate used is specific to each mine and based on its weighted average cost of capital (WACC). I have assumed that WACC is around 7 percent in real terms. This is based on the typical discount rate for equity shareholders used by industry and government analysts of 8 percent in real terms, and the current average cost of debt for the mining sector as reported by Aswath Damodaran, Damodaran Online, www.pages.stern.nyu.edu/~adamodar.
-
161
Republic of the Philippines, Financial or Technical Assistance Agreement, mgb.gov.ph/attachments/article/79/PFC_FTAA.pdf.
-
162
For example, some terms in the original FTAA for an OceanaGold mine differed in some areas: Republic of the Philippines, Financial or Technical Assistance Agreement with Arimco Mining Corporation, 1994, www.resourcecontracts.org/contract/ocds-591adf-2792396017. I understand that the recently signed extension to this agreement has slightly different terms again.
-
163
A template of the FARI model and a user guide that explains all the concepts and workings of the model are available at International Monetary Fund, “Fiscal Analysis of Resource Industries,”www.imf.org/external/np/fad/fari.
Equitable Sharing of Mining Profits: The Best Deal for Tanzania?

-
Tanzania’s unique approach to mining taxation, described as an equitable sharing of economic benefits between government and mining company according to a negotiated split, could leave the country shortchanged.
-
Tanzanian citizens have access to the terms of only one profit-sharing deal, a 50-50 framework agreement for Barrick’s gold mines. The rest remain unpublished, despite laws that require the government to disclose deal terms.
-
The Barrick deal predicates government revenues more heavily on mine profitability than a more typical regime, making these revenues more uncertain. This structure also increases the risk that companies may seek to avoid tax payments.
-
Negotiating the split on a project-by-project basis, without any legal guardrails on the approach, increases the risks of corruption and unfavorable deal terms.
-
The Tanzanian government could eliminate these risks by borrowing provisions from other countries that also require a specific government share of mine profits but take a different approach.
-
However, unless the government has identified benefits from its current sharing mechanism that a more typical regime does not offer, it should not pursue a sharing mechanism and instead focus on improving the underlying regime, such as increasing its flexibility with regards to profits and reducing tax avoidance risks.
-
To gain more trust from citizens, Tanzania’s government should explain how the mechanism works in existing deals.
Summary
Tanzania has taken an innovative approach to mining taxation in recent years, based on an “equitable sharing principle.” It has negotiated deals by which the government and mining companies share “economic benefits” based on an agreed split. Public information about these deals is limited. My understanding of the sharing arrangement is based on: the framework agreement template in the Mining (State Participation) Regulations 2022, the framework agreement between the government and Barrick Gold that first detailed a sharing arrangement in 2019, and discussions with government and industry officials. The agreement with Barrick provides for a 50-50 split. I understand that the government has negotiated a larger share in at least some subsequent deals, but there is no public information about them.
“Economic benefits” are the sum of government revenues, return of shareholder capital, shareholder dividends and shareholder loan repayments. Therefore, by the end of a typical mine’s lifetime, its economic benefits should be broadly equivalent to its total pre-tax profit. Mining companies continue to pay the taxes set out in the legislated fiscal regime, such as royalty and corporate income tax. But discussions indicated that once a mining company has recouped its initial investment, sharing is triggered, and adjustments are made at the end of each year to achieve the agreed split. This sharing arrangement is a significant shift away from the fiscal regime set out in Tanzanian legislation and common across the world.
There are several other countries that require mining companies to pay a specified share of their profits to the government, such as Ecuador and the Philippines. However, Tanzania has taken a different approach. While Ecuador and the Philippines impose only a floor on the government share, the Tanzanian arrangement also imposes a ceiling. This ceiling—which in the Barrick example limits the government share of profit to 50 percent—has several consequences.
My modeling of the impact of the regime on both a gold mine and a nickel mine suggests that the 50-50 regime results in a lower government take than the country’s underlying regime set out in legislation. The underlying regime is likely to result in the government receiving a share of profits greater than 50 percent for much of a mine’s lifetime. Under the 50-50 arrangement, the government therefore must make a payment to the mining company or forgo future tax payments to rebalance.
This does not necessarily mean the 50-50 regime will generate less government revenue overall. The competitiveness of the underlying regime is uncertain, and companies could develop fewer mines under it. However, modeling suggests that the 50-50 regime also results in lower taxes than in many other countries in a comparative sample. A slightly larger government share, which I understand the government has negotiated in at least some other deals, could therefore represent a better balance.
Tanzania sharing of benefits across the lifetime of a gold mine making average profits125
The ceiling on government share has another consequence. It links all government revenues to mine profitability. The government can receive only a total amount capped at 50 percent of total benefits, irrespective of which tax initially provided its revenues. Low profits, which translate to minimal total benefit, could therefore impact even the payment of taxes not directly based on profit. This greater reliance on profitability introduces two risks for the Tanzanian state: it makes revenues less reliable and increases the risk that the mining company will seek to avoid tax payments.
Modeling suggests that there may be years in which the government receives no revenues from a mine that is producing but making low profits. The figure below shows how the government may not receive revenues for two years because of the build-up of benefits that the government receives prior to the point that sharing is triggered. With a mine of average profitability, total benefits are large enough that the government does not have to forgo all its tax payments in any year. However, with low profits, the mining company must retain all benefits for a period to rebalance. The example in the figure below shows the potential impact of the government’s accumulation of benefits prior to the sharing trigger, however periods of no or low profits at other points in the mine’s lifetime could also make revenues volatile.
Tanzania sharing of benefits across the lifetime of a gold mine making low profits, with all benefits shared
The sharing mechanism also significantly increases the government’s exposure to the risk of mining companies avoiding taxes. All government revenues become dependent on government capacity to effectively assess profit rather than just the government revenues from profit taxes. The figure below shows the potential impact of tax avoidance practices increasing costs and therefore reducing total benefits. With the underlying regime, only profit-based taxes such as corporate income tax would be impacted by such tax avoidance practices. These practices would not affect input and production taxes such as royalties. However, with the sharing mechanism, such practices could result in artificially low profits. This could trigger the cap for the government share of benefits and mean reductions in payments such as royalties, even though these payments are not usually dependent on profitability—which is one of the main reasons they are included in fiscal regimes.
Hypothetical exposure to tax avoidance risk with Tanzania's fiscal regimes126
The government may not have anticipated these risks because the sharing arrangement was initially developed for mines that were already producing, for which the risks are lower. The largest costs for producing mines have already been incurred, and so there is a lower risk of the sharing mechanism making revenues unreliable and there are fewer opportunities for tax avoidance. However, the government should consider whether this approach is optimal for new mines.
A larger government share of benefits reduces the risks of unreliable revenues and of tax avoidance. The higher the ceiling, the less likely government revenues are to hit it. Payments of input and production taxes such as royalties are therefore less likely to be reduced. However, a larger government share does not eliminate this risk.
The flurry of framework agreements that the Tanzanian government has signed since the Barrick deal suggests that investors like the sharing arrangement. It does not appear to be beneficial for Tanzania, however. This is particularly concerning given that the energy transition and resulting surge in demand for many of Tanzania’s minerals mean there is even more to lose.
Negotiating the split on a project basis, without any guardrails in legislation on the approach to this split, increases the risk of a bad deal for the country. The Mining (State Participation) Regulations allow the government to negotiate the sharing of economic benefits. However, legislation provides only a limited methodology for calculating economic benefits and does not provide a range within which the split will be agreed. Given that the split essentially overrides the underlying fiscal regime set out in legislation, this lack of guardrails is concerning. It increases the impact of uneven capacity between the government and company negotiating teams, the likelihood of costly mistakes, and the risk of corruption. An uneven fiscal regime is also more difficult to administer.
The government could look to Ecuador and the Philippines’ regimes for ideas on how to refine its approach. Those countries have avoided these risks by setting only a floor on the government share. By allowing the mining company to earn its minimum return before sharing is triggered, Ecuador’s sharing mechanism performs more like a windfall profit tax. It therefore reduces the risk of making marginal mines unviable.
However, removing the ceiling from Tanzania’s sharing mechanism will likely result in most mines paying the tax level in the underlying regime. This is because the relatively high taxes of Tanzania’s underlying regime will make the floor on the government share redundant. The government could therefore decide not to pursue a sharing mechanism of any form in new deals, since it becomes an unnecessary complication.
Unless the government has identified benefits to the sharing mechanism that a more typical regime does not offer, it is better for the country that the government focuses on improving the underlying regime. Tanzania’s taxes are less responsive to mine profitability than most other regimes, which risks making some of Tanzania’s mines unviable. The government could therefore consider a royalty rate that varies with prices. It could also review its approach to tackling tax avoidance risks from inflated financing costs. For example, rather than taking a share of shareholder loan repayments, which may not have the intended effect, it could prohibit the interest rate on any loan from exceeding the lowest market rate available for such loans.
Even if the government decides not to incorporate a sharing mechanism in any new deals, explaining to the public how the mechanism works in existing deals is critical. The lack of public information and understanding of the mechanism risks undermining public trust in the government’s management of the sector. Part of this public sensitization should include disclosure of the contracts that contain the “benefit sharing” approach, as already required by law.
Introduction
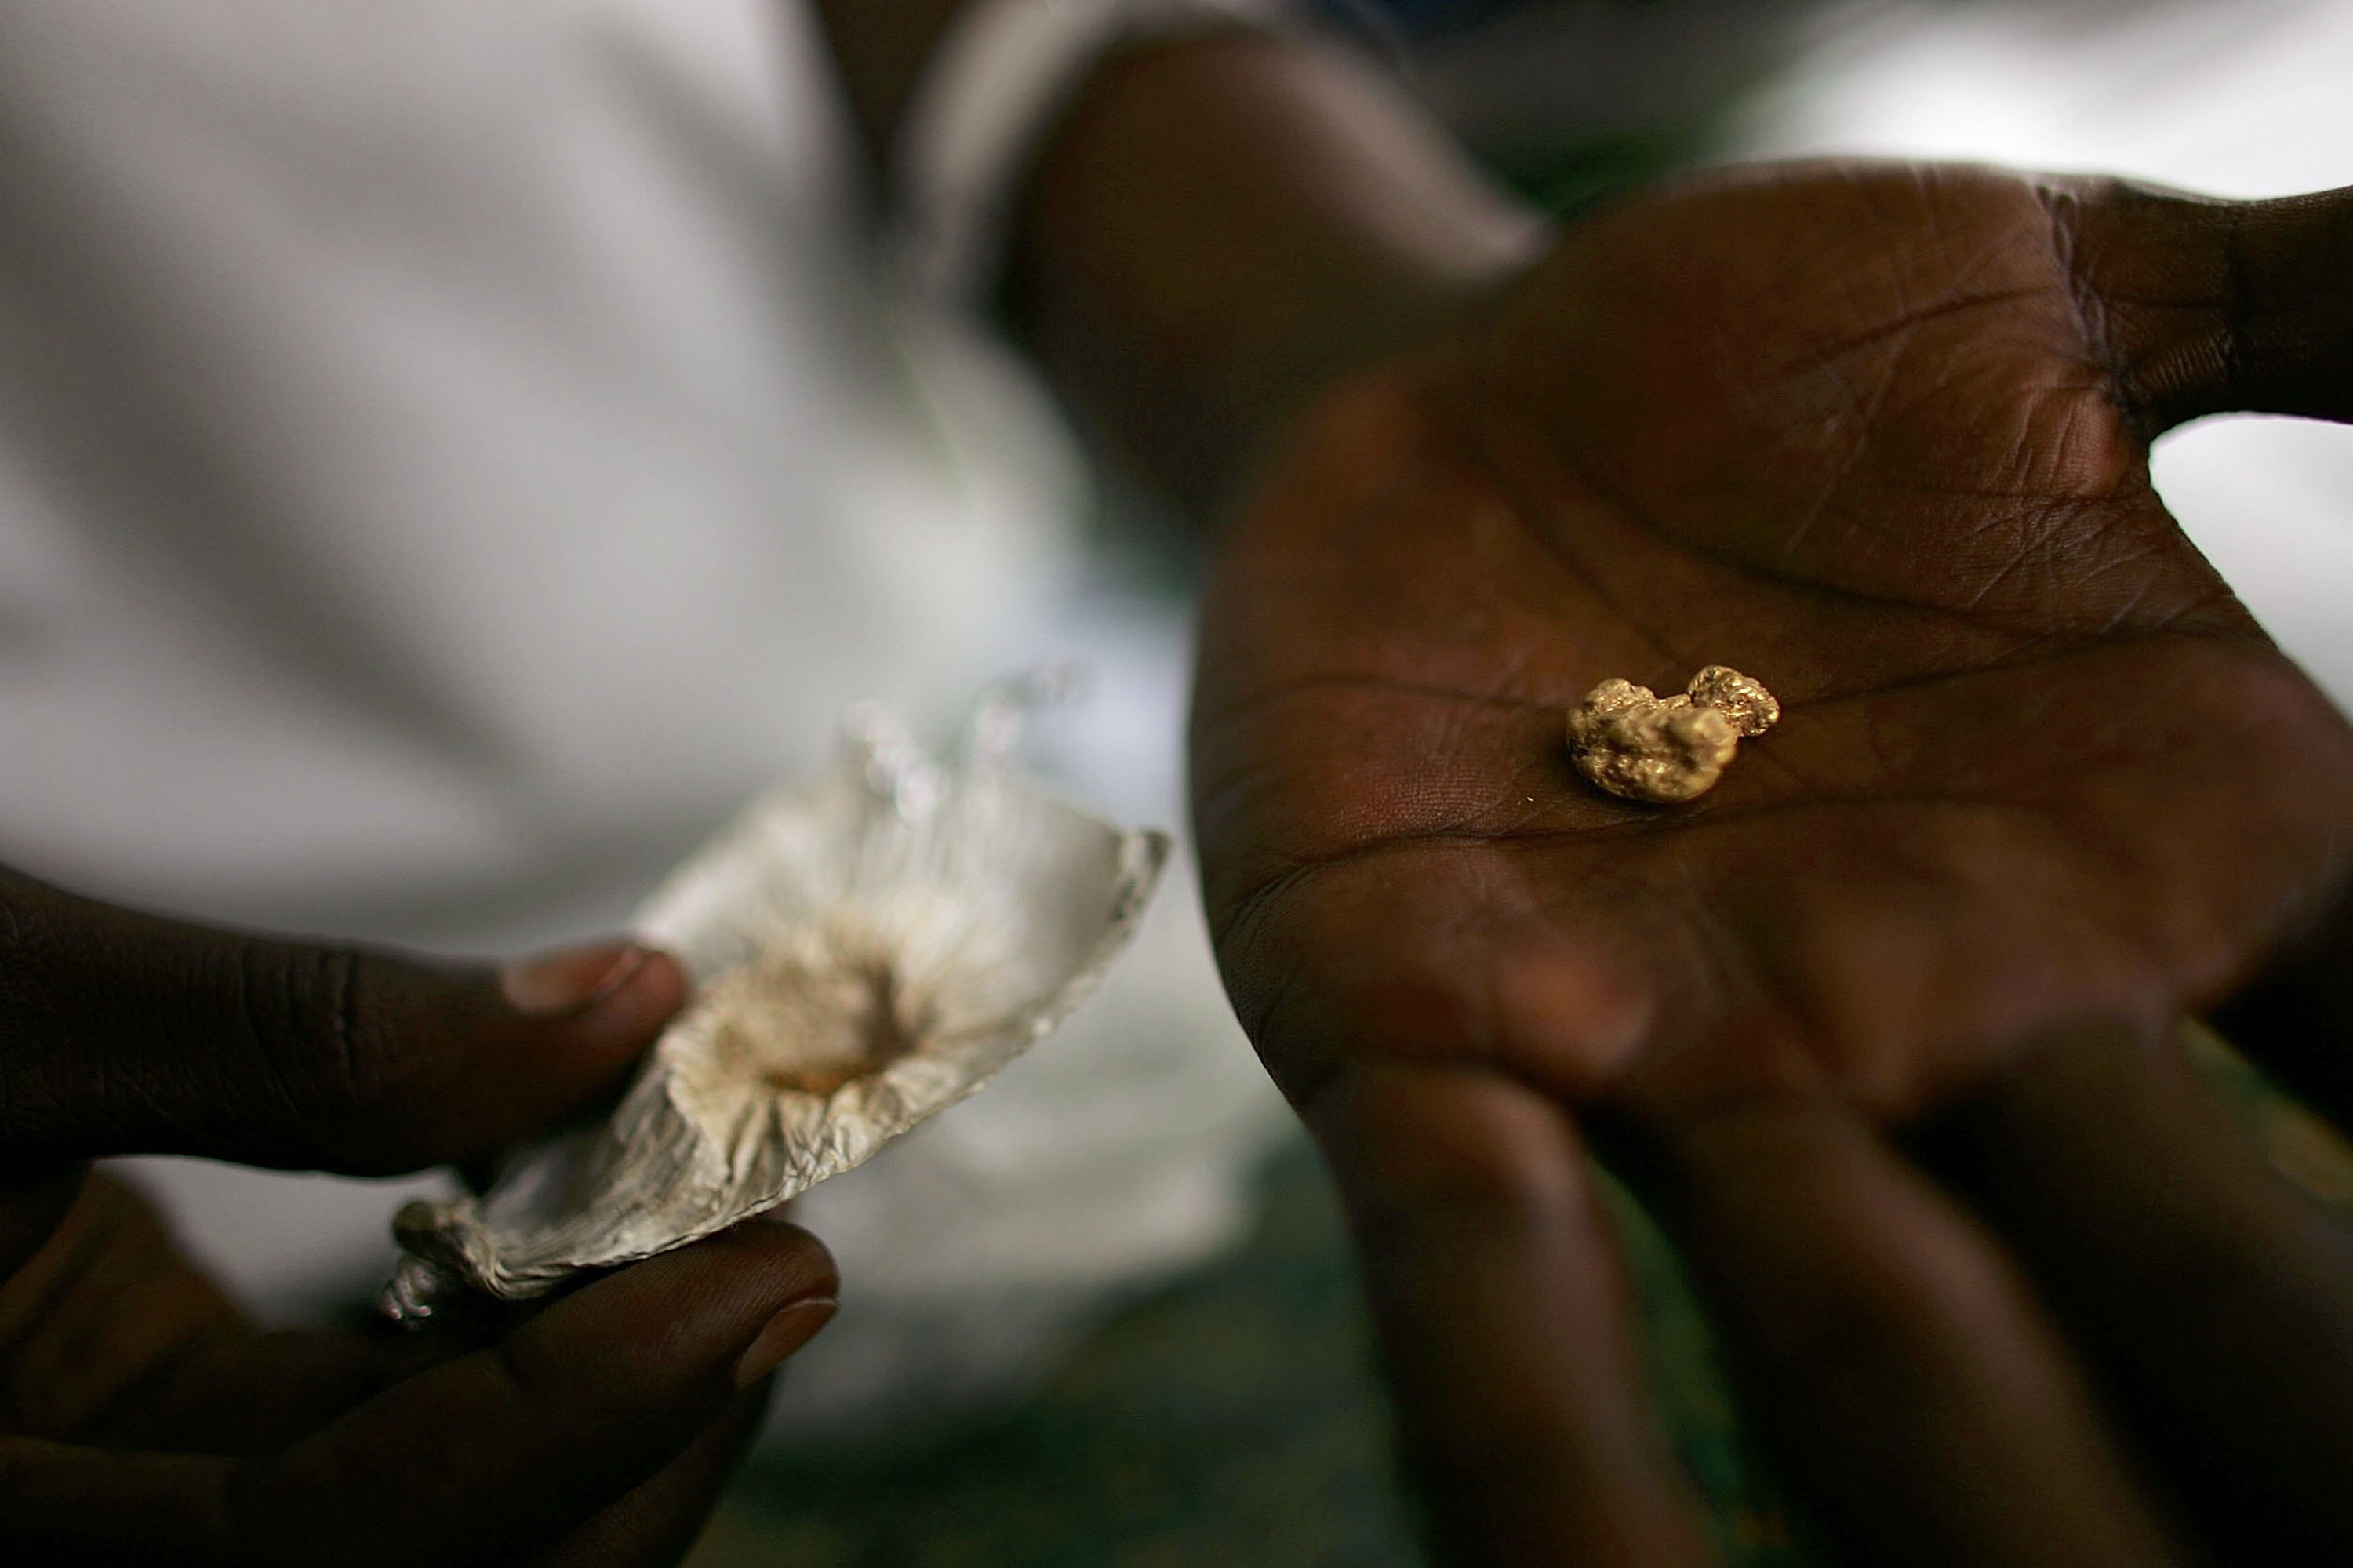
In 2019, Tanzania and Barrick Gold renegotiated the mineral development agreements (MDAs) for three of the country’s gold mines. The renegotiated deals provide for a 50-50 share of “economic benefits.” Since then, the government has entered a 55-45 sharing arrangement with Petra Diamonds for Tanzania’s only large-scale diamond mine, with the government receiving the larger share.127 These mines are already producing, but the government has also applied this sharing approach to deals for at least some new projects. The largest mine in the pipeline—Kabanga, which will produce nickel and cobalt—has signed a framework agreement with the government that provides for economic benefits to be “equitably shared.”128
This sharing arrangement is a significant shift away from the fiscal regime set out in Tanzanian legislation and common across the world. The typical regime is based on royalties and corporate income tax, without any adjustment mechanism to achieve a specified government share of mine profits overall. I analyzed this regime previously, benchmarking it against a range of other mining countries.129 I now analyze the Tanzanian sharing arrangement to establish whether it represents a better deal for the country. I then explore how the government could refine it as it negotiates deals for new projects in the pipeline. Lessons are drawn from the approach of Ecuador and the Philippines, which also target a specified share of a mine’s profits for the government but in different ways.
The economic model and data that I used for this analysis are available on the Natural Resource Governance Institute’s website here. I provide further information on my modeling approach in subsequent sections and the appendix.
1. Key difference between benefit-sharing approaches: Tanzania’s ceiling on the government share

Public information on the structure of Tanzania’s sharing arrangements is limited. While the Mining (State Participation) Regulations 2022 provide for the government to negotiate the sharing of economic benefits on the basis of an “equitable sharing principle,” they do not fully set out its structure. The Barrick MDAs and agreements for other projects have not been disclosed. The framework agreement between the government and Barrick that informed the MDAs provides the most comprehensive outline of the structure that is publicly available.130 I therefore focus on this 50-50 arrangement, but also discuss the implications of a different split, such as the 55-45 agreed with Petra Diamonds, in my analysis. The three key elements of the sharing arrangement are set out below.
Definition of economic benefits. “Economic benefits” could be interpreted to mean different things. The broadest definition would entail not only direct financial benefits from the mine in the form of government revenues and company profits, but also benefits such as the creation of jobs and demand for goods and services. However, the Mining (State Participation) Regulations state that “economic benefits” comprise of government revenues directly payable by the company to the government,131 shareholder dividends and shareholder loan repayments. Therefore, by the end of a typical mine’s lifetime, its economic benefits should be broadly equivalent to its total pre-tax profit. These benefits are calculated on a cumulative basis from the start of a mine’s operations (that is, from the start of the license period). I understand that cumulation in this case is based on actual not discounted cash flow, and therefore does not account for the time value of money.132
Trigger for sharing mechanism. Sharing is triggered once cumulative, post-tax cash flow is positive, meaning that all exploration and development costs have been recouped. My understanding is that the timing of this trigger is set in advance using the mine life plan rather than based on actual performance.
Sharing mechanism. The mining company pays the taxes set out in the fiscal regime, such as royalty and corporate income tax, in line with the typical approach. However, after the sharing trigger, if one party’s cumulative share of economic benefits is greater than 50 percent at the end of a year, it must pay the other party the amount required to rebalance. This payment could be made at that point in time or, if the company has overpaid, treated as an advance payment of future taxes.
Several other countries require mines to pay a specified government share
The Ecuador and Philippines regimes also require a government share of profits of 50 percent. Each country’s definition of profits differs slightly. However, a more significant difference is that, unlike under the Tanzanian approach, if the Ecuador or Philippines government receives a share of more than 50 percent, the government does not have to compensate the mining company. In other words, their mechanisms act as a floor but not a ceiling on the government’s share.
Another key difference between the regimes is that, while the Tanzania and Ecuador regimes calculate the benefits accrued by the government or mining company on a cumulative basis, the Philippines regime does not. However, while cumulation is based on actual cash flow in the Tanzania regime, it is based on discounted cash flow in the Ecuador regime. This means that sharing is triggered in Ecuador only once the mining company has earned its minimum rate of return—that is, the return the company needs to be willing to develop the mine initially.133
Further details of the Ecuador and Philippines regimes are set out in the appendix.
Modeling the benefit-sharing arrangement for gold and nickel mines
I modeled how the Tanzania, Ecuador and Philippines approaches may work for a gold mine and a nickel mine of average profitability. I assumed a gold price of USD 1,600 per ounce and a nickel price of $17,000 per tonne, which are around the 10-year average between 2013 and 2022.134 In the figures below, “initial government benefits” are the revenues the government would have received without the sharing mechanism and “final government benefits” the revenues it ultimately receives after any rebalancing. I show only the results for the gold mine below, but the results for the nickel mine were similar.
Tanzania. As Figure 1 shows, the government receives benefits from the mine prior to the sharing trigger from input taxes, royalty and some corporate income tax payments. Sharing is triggered in year 7 of the project’s life. The government will have a cumulative share that is significantly greater than 50 percent at this point. It therefore must make a payment to the mining company or forgo future tax payments to rebalance. I modeled the latter, given it will probably be politically difficult for the government to make a direct payment to the company. Following this initial rebalancing, the fiscal regime continues to generate a larger initial share of the benefits for the government than for the company. The government therefore continues to forgo a portion of future tax payments to rebalance. At no point in this scenario does the sharing mechanism result in an increase in government revenue.
Figure 1. Tanzania sharing of benefits across the lifetime of a gold mine making average profits135
Ecuador. As Figure 2 shows, sharing is triggered in year 8 of the project’s life. This is a year later than with the Tanzania approach because, unlike with the Tanzania approach, the mining company is permitted to earn its minimum return before sharing. From this point until year 12, annual company returns are significantly greater than government revenues. Therefore, despite the government having received revenues in previous years, its share of cumulative benefits falls below 50 percent, and the company makes an additional payment. However, these payments do not result in the government and company receiving the same monetary amount each year. Sharing is based on discounted cash flow. The revenue the government received in the early years of the mine is worth more than the same monetary amount received by the company later. This reduces the size of the additional payments the company needs to make for cumulative benefits to be shared equally.
Figure 2. Ecuador sharing of benefits across the lifetime of average gold mine136
Philippines. As Figure 3 shows, the recovery period ends after three years of production, in year 7 of the project’s life. Because the basic government share is less than 50 percent of net mining revenue at this point until year 16, the mining company pays an additional government share. For the following few years, the basic government share is at least 50 percent of net mining revenue. This means the company does not make any additional payments. However, unlike with the Tanzania approach, the government does not have to compensate the company for receiving more than 50 percent of net mining revenue.
Figure 3. Philippines sharing of benefits across the lifetime of average gold mine137
2. Tanzania’s benefit-sharing arrangement could leave the country shortchanged
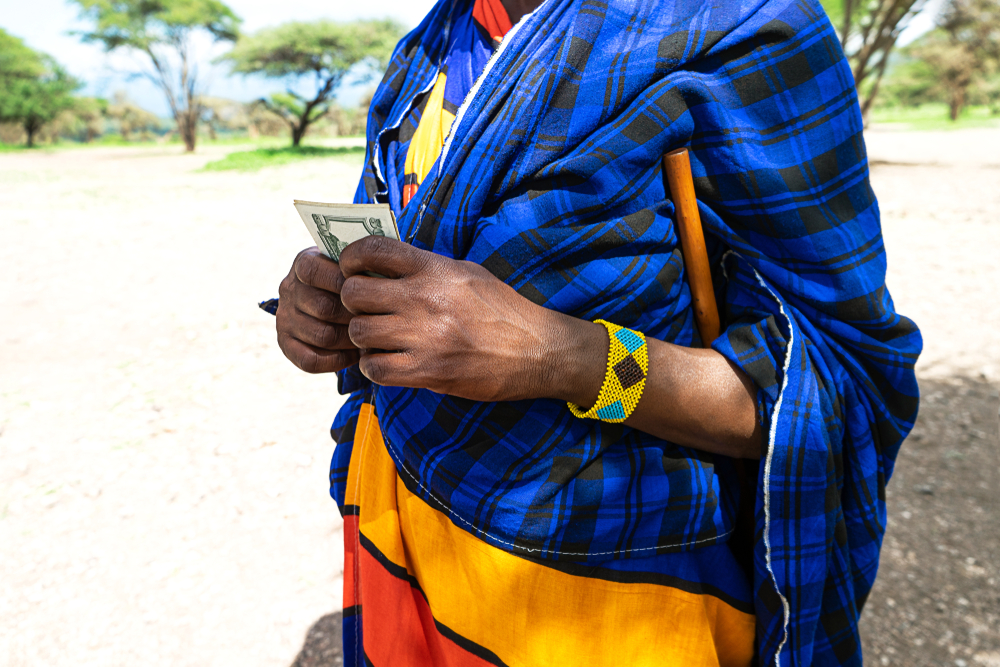
I reviewed the Tanzanian approach against the typical objectives of a fiscal regime: maximizing government revenue without deterring investment; reliable revenues; flexibility as profits change; and simplicity to limit tax avoidance risks.
Typical objectives of a fiscal regime
Maximizing government revenue without deterring investment. A fiscal regime should set the highest taxes that a mine can bear without discouraging investment. What this tax level is depends on the country’s wider investment climate. This is because investors often place greater weight in their investment decision on several non-fiscal factors, such as a country’s geology and policy predictability, than on the tax level.138
Reliable revenues. Many governments want a regime that generates some revenue for their budget each year irrespective of whether a mine is making low or high profits. Reliability is particularly important for countries that depend heavily on the mining sector to finance the budget. However, high taxes when a mine is making no or low profits can prevent low-profit mines from being developed or surviving downturns. A regime must therefore balance reliability with ensuring a wide range of mines are viable across different scenarios.
Flexibility as profits change. A regime should aim to capture any profit above the investor’s minimum return, with flexible (or “progressive”) taxes significantly increasing government take once this threshold has been reached.139
Simplicity. Governments are often concerned about tax avoidance.140 Some taxes (namely those based on profitability) are more difficult to measure than others, which makes them more susceptible to company manipulation. Governments therefore tend to want the regime to contain at least some simple taxes (such as royalties), depending on their tax administration capacity.
I set out below how the 50-50 regime performs against these criteria in relation to a new gold mine. I compared the performance of the 50-50 regime with the underlying regime. I also compared it with the Ecuador and Philippines regimes—with and without their sharing mechanisms to isolate their effect and draw lessons for Tanzania—as well as with some of the world’s other gold producers. Tanzania is competing with these countries for investment, and therefore how they compare is important. I also analyzed the impact of these regimes on a nickel mine and found similar results.
The benefit-sharing arrangement reduces government take
Tanzania’s 50-50 regime has a lower government take than the country’s underlying regime set out in legislation. This is because of the ceiling it imposes on the government’s share. This does not necessarily mean it will generate less government revenue overall, however. More mines could potentially be developed under the 50-50 regime if investors prefer it, thereby resulting in higher aggregate government revenues.
Figure 4 sets out how the government take differs between Tanzania’s two regimes, and how they compare to the regimes of Ecuador, the Philippines and several other gold producers. I used the average effective tax rate (AETR) to make this comparison.
The 50-50 regime appears to strike a reasonable balance between generating government revenue and competitiveness for a mine with average profitability. As Figure 4 shows, I estimate it has an AETR of around 54 percent.141 However, this is lower than for several other countries in my sample. Tanzania therefore probably has scope for slightly higher taxes than the 50-50 regime entails without reducing the country’s competitiveness. This is particularly the case given government efforts to improve the wider investment climate appear to be paying off. Control Risks considers Tanzania’s legal and tax risks to be on a downward trend.142 Indeed, I understand the government has negotiated a larger share in at least some other deals.
In contrast to the Tanzanian mechanism, Ecuador’s and the Philippines’ mechanisms both increase government take from a mine with average profitability, compared to the regimes that would otherwise be applicable. However, the Ecuador mechanism has a larger impact. This is because it does not count several significant taxes—such as import duties and withholding taxes on interest and dividends—toward the government’s share of benefits. The exclusion of these taxes increases the additional payment the mining company must make for the government to receive 50 percent of cumulative benefits.
Figure 4. Average effective tax rate for average gold mine with gold price of USD 1,600 per ounce143
The benefit-sharing arrangement both limits windfall profits capture and makes revenues unreliable
Figure 5 shows government take at different profit levels—measured in terms of government share of total benefits.144 A regime should set government take from low-profit mines to generate reliable revenues while still providing the minimum return to investors. A flexible regime would then have much higher government take from higher-profit mines. The AETR for these mines would be flat, with flexible instruments to capture windfall profits balanced out by reliable instruments such as royalties. This translates to government share of total benefits slightly increasing with profit.145
Figure 5. Government share of total benefits at different profit levels146
The instruments in Tanzania’s underlying regime make it relatively inflexible. Its corporate income tax and minority state equity mean that it should capture windfall profits reasonably well, if effectively administered. However, the regime also places high taxes on low-profit mines, largely because of a high royalty. As I noted in my previous analysis, the government could consider adjusting these instruments to make the underlying regime more flexible.147
The sharing mechanism also limits the flexibility of the regime since it is designed to preserve the share of government in total benefits, regardless of economic conditions. The mechanism results in the regime capturing a similar share of profits whether a mine generates low or high profits.148 This means the government must decide, when determining the split between government and mining company, whether to impose a large government take on low-profit mines and capture a large share of any windfall profits; or to provide more relief to low-profit mines but in doing so to capture a smaller share of windfall profits. The 50-50 split takes the latter approach, making low-profit mines more likely to be viable than with the underlying regime. However, the sharing mechanism means that this must come at the cost of a smaller government share of windfall profits.
The sharing mechanism also makes government revenues unreliable. This is because it makes all government revenues dependent on the size of total benefits. The government can receive only 50 percent of total benefits irrespective of which tax they were initially derived from. Low profits, which in turn mean total benefits are small, could therefore impact even the payment of taxes not directly based on profit.
As Figure 6 shows, my modeling suggests there may be years in which the government does not receive any revenues from a mine with low profits. In this scenario, these two years of no government revenues are caused by the build-up of benefits that the government receives prior to the sharing trigger. Once sharing is triggered, the government must forgo tax payments to rebalance and for 50-50 sharing to be achieved. With a mine of average profitability, total benefits are large enough that the government does not have to forgo all its tax payments in any year, as shown in Figure 1. However, with low profits, the mining company must retain all benefits for a period to rebalance.
While this example shows the potential impact of the government’s accumulation of benefits prior to the sharing trigger, periods of no or low profits at other points in the mine’s lifetime could also make revenues volatile. Therefore, while the sharing mechanism may still generate reasonable government revenues over the project’s lifetime, it appears to undermine the reliability of revenues from year to year. As a result, it appears to create a regime that neither captures a significant share of windfall profits compared to many of the countries in our sample nor provides reliable revenues when profits are low.
Figure 6. Tanzania sharing of benefits across the lifetime of a gold mine making low profits, with all benefits shared149
This lack of reliability could have significant repercussions for public trust. As noted above, I do not think it will be politically feasible for the government to make a direct payment to the mining company when the government has captured a greater share of the benefits than the agreed split. It is more likely that the government will forgo future tax payments. However, a scenario in which the government will need to forgo all tax payments in a given year will also be politically difficult. As a result, the sharing arrangement could create situations in which the government feels forced into entering supplementary arrangements to ensure it receives some revenues each year—for example, an arrangement that spreads the amount required to rebalance over several years.
Such arrangements, whether fully disclosed to the public or not, could lead to the sharing approach reducing public trust. This loss of trust would put pressure on the government to change the fiscal regime and even the wider legal and regulatory framework. If acted on, this could shake confidence in policy predictability and deter investment, as the country experienced following the sweeping reforms in 2017.150
In contrast to the Tanzania mechanism, the Ecuador mechanism helps increase flexibility. The mining company being able to earn its minimum return before sharing, and sharing being based on cumulative benefits, means the mechanism has a limited impact on low-profit mines. For higher-profit mines, it increases government take. In this way, it operates much like a windfall profit tax. Nonetheless, its flexibility could be improved further. The exclusion of some taxes from the government’s share of benefits means that even low-profit mines may need to make an additional payment. This is particularly impactful because the rest of the Ecuador regime imposes a relatively high burden on mines even when profits are low.
The Philippines’ mechanism improves the government’s ability to capture windfall profits. However, it risks increasing the burden on low-profit mines. This is because, while the limited taxes during the recovery period provide some relief, sharing is triggered before the mining company earns its minimum return and is based on annual not cumulative benefits. This also limits the scope to capture an even greater share of windfall profits through the sharing mechanism, as a larger government share would risk a higher burden on low-profit mines. A separate windfall profit tax would therefore be needed for this purpose instead.
The benefit-sharing arrangement increases tax avoidance risks for Tanzania
The Tanzania mechanism significantly increases the government’s exposure to tax avoidance risks. As noted above, all government revenues become dependent on profit. They therefore all become dependent on government capacity to effectively assess profit rather than just the government revenues from profit taxes.
Figure 7 shows the potential impact of tax avoidance practices increasing costs and therefore reducing total benefits. The increase in costs does not affect the payment of input and production taxes with the underlying regime. However, it does with the sharing mechanism as it means 50 percent of total benefits includes a lower value of the input and production taxes that would have been due to the government.
Figure 7. Hypothetical exposure to tax avoidance risk with Tanzania's fiscal regimes151
This feature of the mechanism exists regardless of the size of the split. A larger government share reduces the risk that tax avoidance will lower total benefits to the extent that the government’s share is less than the value of input and production taxes. However, it does not eliminate that risk.
The Ecuador and Philippines mechanisms, in contrast, do not significantly affect government exposure to tax avoidance risks. Determining the need for additional payments to government depends on government capacity to effectively measure profits. But because these regimes do not place a ceiling on the government’s share, tax avoidance that reduces profits would not affect the payment of input and production taxes.152
The Tanzania regime does contain measures intended to reduce tax avoidance risks related to financing costs. I understand that the Barrick MDAs treat related party loans as being interest free in the calculation of total benefits. The Mining (State Participation) Regulations also unusually provide for mandatory state equity in projects to give the government a share of any shareholder loan repayments. This provision is intended not only to generate larger government revenues directly, but also to reduce the incentive to shift profits through inflated financing costs.153
These protective measures are not tied to the structure of the sharing mechanism, however. They could be included in any regime. Indeed, the sharing mechanism appears to neutralize the impact of taking a share of loan repayments. The government can receive only 50 percent of economic benefits regardless of whether they are generated from a share of loan repayments or other revenue streams.
3. Tanzania may do better by not including the benefit-sharing mechanism in new deals
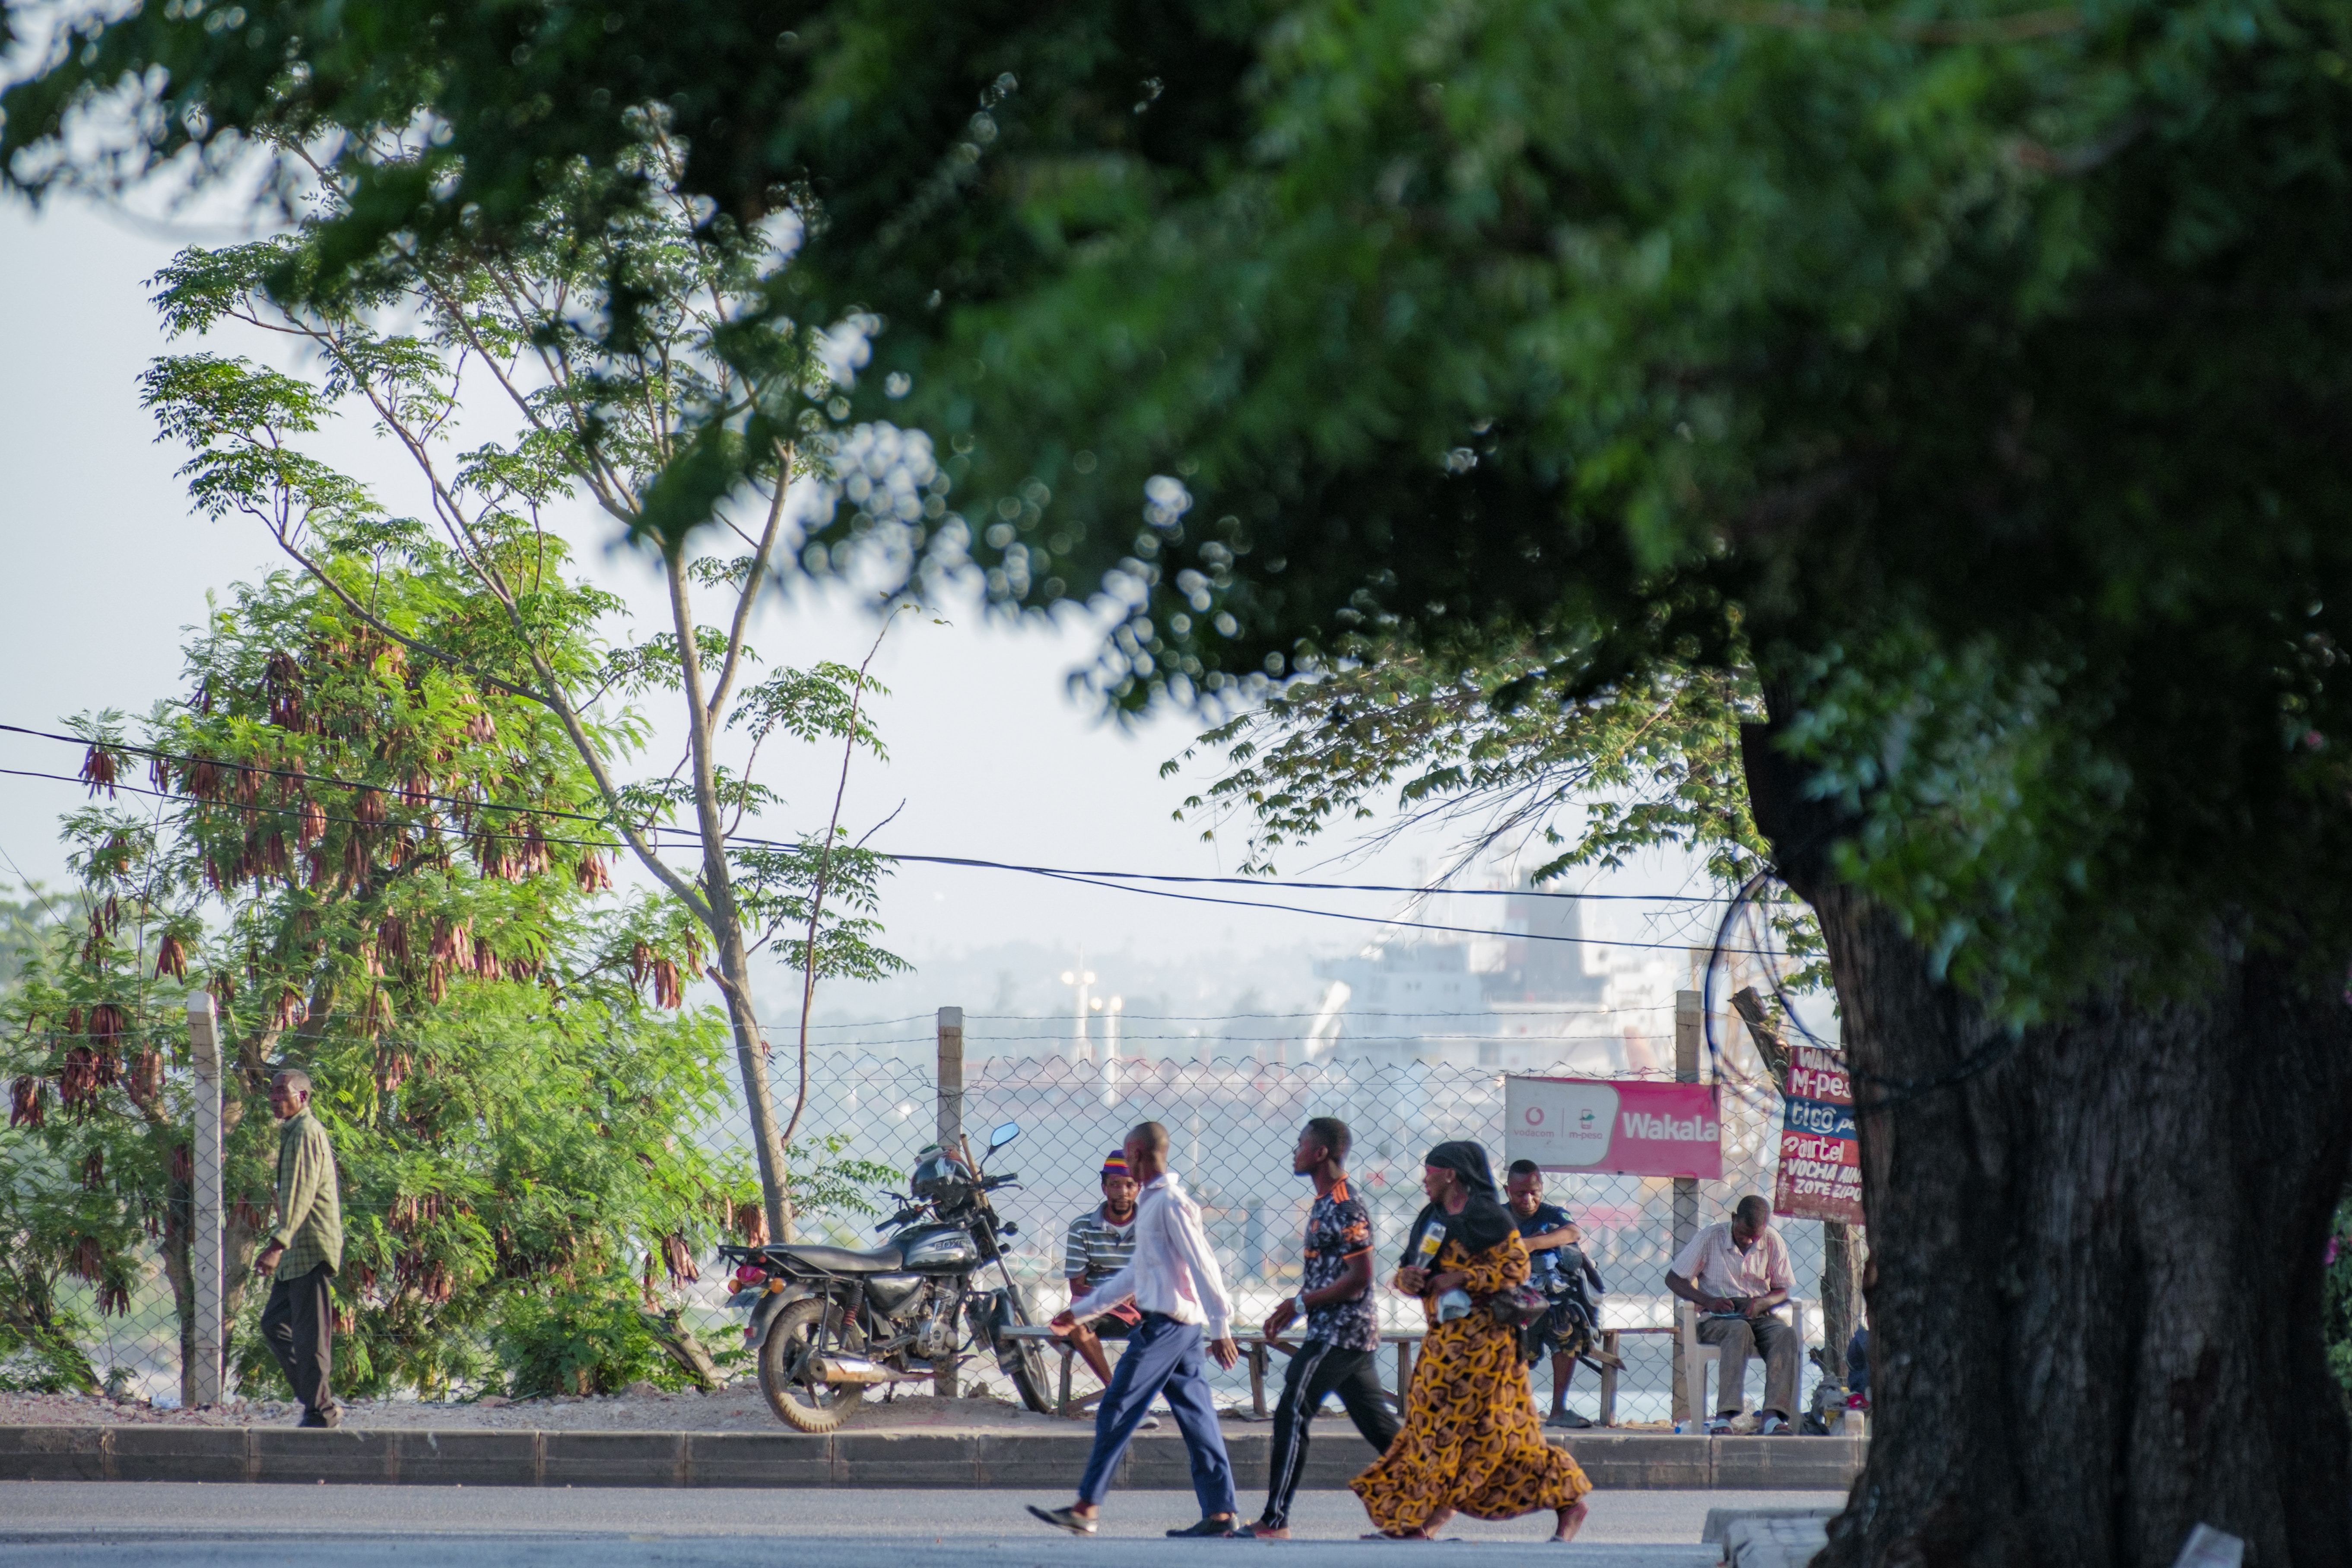
Setting not just a floor but also a ceiling on the government share has introduced three main risks into Tanzania’s regime: it potentially sets an unnecessarily low ceiling on government revenues (depending on the agreed split); it makes those revenues less reliable; and it increases their exposure to tax avoidance.
The government may not have anticipated some of these consequences because it initially developed the sharing arrangement for mines that were already producing. The largest costs for these mines have already been incurred and they are now profitable. This reduces the risk of the sharing mechanism making revenues unreliable and increasing the potential for tax avoidance. However, it would be advisable for the government to consider whether this approach is optimal for new mines. Particularly given the energy transition and resulting surge in demand for many of Tanzania’s minerals, there is even more to gain from a good deal and even more to lose from a bad deal.
A larger government share of benefits reduces the risk of unreliable revenues and tax avoidance. However, it does not eliminate this risk. Negotiating the split on a project basis, without any guardrails in legislation, increases the risk of a bad deal. Legislation provides only a limited methodology for calculating economic benefits and does not provide a range within which the split will be agreed. Given that the split essentially overrides the underlying fiscal regime set out in legislation, this lack of guardrails is concerning. It increases the impact of uneven capacity between the government and company negotiating teams, the likelihood of costly mistakes and the opportunity for corruption. An uneven fiscal regime is also more difficult to administer.154
The government could look to Ecuador and the Philippines’ regimes for ideas on how to refine its approach. By setting only a floor on the government share, their sharing mechanisms do not exacerbate the risk of unreliable revenues and tax avoidance. By allowing the mining company to earn its minimum return before sharing is triggered, Ecuador’s sharing mechanism performs more like a windfall profit tax. It therefore reduces the risk of making marginal mines unviable.155
Removing the ceiling from Tanzania’s sharing mechanism is complicated by the relatively high taxes of Tanzania’s underlying regime. A floor of 50 percent of profits results in Ecuador and the Philippines receiving additional payments because government take from other taxes in their regimes does not reach that threshold. This is not the case for Tanzania as government take already exceeds that floor.
Figure 8 shows my modeling of a gold mine of average profitability. The mechanism—without a ceiling and the calculation of benefits based on discounted cash flow to allow mining companies to earn their minimum return before sharing is triggered—does not have any effect on the share of benefits between the government and company. My modeling suggests the mechanism would also not have any effect on this share for mines of higher and lower profitability.
Figure 8. Tanzania sharing of benefits across the lifetime of a gold mine making average profits with no ceiling156
Removing the ceiling from the sharing mechanism will therefore likely result in most mines paying the tax level in the underlying regime. The government could of course increase the floor so that the mechanism does result in mines making additional payments. My modeling suggests a floor of close to 60 percent would trigger additional payments from a range of mines. However, this would not be advisable given the underlying regime already has higher taxes than most other countries in my sample. Increasing government take would further challenge Tanzania’s competitiveness, even if these additional payments were payable only once the mining company had earned its minimum return.
The adjustments I suggest would therefore make the sharing mechanism superfluous for most mines. The government could therefore decide not to pursue a sharing mechanism of any form in new deals given it becomes an unnecessary complication. Indeed, the government is better focusing on improvements to the underlying regime. As set out above, Tanzania’s taxes are less responsive to mine profitability than most other regimes I analyzed. The government could therefore consider a royalty rate that varies with prices.157 This would provide some relief to mines when prices are low, and capture more revenue for government when prices are high. The government could also review its approach to tackling tax avoidance risks from inflated financing costs. For example, rather than taking a share of any loan repayments, it could consider adopting a rule for the mining sector that is currently only in the Petroleum Act: that the interest rate on a loan should not exceed the lowest market rate available for such loans.158
Conclusion
The Tanzanian government should be commended for its willingness to pursue an innovative approach to mining taxation after years of frustration at the deals it had previously struck. However, without reassessing this approach, it risks leaving itself shortchanged again—particularly given the lack of guardrails in legislation. Considering the challenges with the arrangement I have identified, there may be a sense of déjà vu in the longer term with a public backlash against both mining companies and the government.
The government could adjust the mechanism before finalizing deals for new mines by borrowing elements from the Ecuador and Philippines regimes. However, unless the government has identified benefits from the sharing mechanism that a more typical regime does not offer, the best option is not to pursue a sharing mechanism of any form and instead to focus on improving the underlying regime.
Even if the government decides not to incorporate a sharing mechanism in any new deals, explaining to the public how it works in existing deals is critical. The current lack of public information and understanding of the mechanism risks undermining public trust in it. Part of this public sensitization should include disclosure of the contracts that contain the mechanism, as already required by the Tanzania Extractive Industries (Transparency and Accountability) Act 2015. The government could also consider publicly reporting the expected or observed economic benefits from the mines to which a sharing arrangement applies. This should also help increase public trust that the country is receiving the amount that it is due.
Appendix: Ecuador and Philippines regimes
Ecuador’s approach
The Ecuador regime requires mines to provide a government share of at least 50 percent of “accumulated benefits.” This requirement is established in the constitution of the country. It is primarily set out in the general regulations of the mining law.
Definition of accumulated benefits. “Accumulated benefits” are the sum of the government revenues specified in the regulations and any free cash flow available to the mining company.159 These benefits are calculated on a cumulative basis from the start of a mine’s operations (though the applicable government revenue streams are payable only from the start of production). This cumulation accounts for the time value of money. Cash flows are discounted to reflect that, the earlier they occur, the more they are worth to either party.160
Trigger for sharing mechanism. Sharing is triggered once cumulative, discounted free cash flow is positive. At this point, the mining company has recouped all exploration and development costs. Because the trigger is based on discounted cash flow, it will also have earned its minimum rate of return.
Sharing mechanism. The mining company pays the taxes set out in the fiscal regime in line with the taxes and royalties defined in legal and contractual provisions. After the sharing trigger, if cumulative government revenues are less than 50 percent of accumulated benefits at the end of the year, the company must pay a “sovereign adjustment” to increase the government share to 50 percent. However, if government revenues are more than 50 percent of accumulated benefits, the government does not have to compensate the company.
Philippines’ approach
The Philippines regime requires mines that operate under a financial or technical assistance agreement (FTAA) to provide a government share of at least 50 percent of annual “net mining revenue” after a cost recovery period. Any mine licensed to a foreign company must have a FTAA.161 This arrangement is primarily set out in a publicly available model FTAA. The financial or technical assistance agreement for a given project is subject to negotiations and therefore may differ slightly from others.162 I focus on the regime set out in the model FTAA.
Definition of “net mining revenue.” Net mining revenue is sales revenue (net of transport and processing charges) minus deductible expenses in a given year. Deductible expenses include, among other things, development costs after the start of production, operating costs, interest payments and royalties.
Trigger for sharing mechanism. The sharing mechanism is triggered at the end of the “recovery period.” The recovery period ends the earlier of five years from the start of production or the point at which all pre-production expenses have been recouped. The timing of this trigger is based on the actual performance of a mine rather than set in advance.
Sharing mechanism. The mining company pays the “basic government share” throughout the project’s lifetime. However, the composition of this basic government share up to the end of the recovery period and after the recovery period differs. A comprehensive list of the taxes included in the government share during these two periods can be found in the model FTAA and applicable legislation. The main components up to the end of the recovery period include excise tax, royalties and local business tax. The basic government share after the recovery period includes these taxes as well as import duties, corporate income tax, and withholding taxes on interest and dividends.
After the end of the recovery period, if the basic government share is less than 50 percent of net mining revenue in a given year, the mining company must pay an “additional government share” to increase the total government share to 50 percent of net mining revenue. However, if the basic government share is more than 50 percent of net mining revenue, the government does not have to compensate the company.
Modeling approach
I used an adapted version of the IMF’s Fiscal Analysis of Resource Industries (FARI) economic model published in 2016 for this analysis.163
I based my analysis on two mines: one produces gold doré and the other produces primarily nickel sulfide but also some cobalt. As the effects of a fiscal regime can differ depending on the specific cost, production and ultimate profitability of a mine, I created a range of mine profiles. I based the gold mine profiles on the characteristics of actual mines in Tanzania, using S&P Global Market Intelligence’s Capital IQ Pro database. The S&P database does not yet contain detailed economic data for any of Tanzania’s upcoming nickel mines, and therefore I developed rough approximations based on their potential size and the cost of other nickel mines across the world. I also made assumptions about the financing structure of these mines. I based these assumptions on the values used as common practice by industry and government analysts.
The assumptions I used for the two gold mine profiles referenced in this analysis are set out in Table 1. These assumptions result in a pre-tax internal rate of return of 42 percent for the average-profit mine and 17 percent for the low-profit mine.
Table 1. Key assumptions for modeled gold mine profiles
|
Parameter |
Average-profit mine |
Low-profit mine |
|
Peak production of gold |
350,000 ounces |
100,000 ounces |
|
Production life |
24 years |
16 years |
|
Development and expansion capital |
$300 million |
$450 million |
|
Replacement capital per year |
$40 million |
$8 million |
|
Operating cost |
$700 per ounce |
$800 per ounce |
|
Transport, treatment and refining charges (TC/RC) |
$3 per ounce |
$6 per ounce |
|
Debt-to-equity ratio |
50% |
50% |
|
Real discount rate of equity shareholders |
8% |
8% |
|
Real interest rate on debt |
6% |
6% |
|
Inflation rate |
2% |
2% |
The assumptions I used for the nickel mine profiles in this analysis are set out in Table 2. These assumptions result in a pre-tax internal rate of return of 35 percent for the average-profit mine and 16 percent for the low-profit mine.
Table 2. Key assumptions for modeled nickel mine profiles
|
Parameter |
Average-profit mine |
Low-profit mine |
|
Peak production of nickel |
40,000 tonnes |
15,000 tonnes |
|
Associated cobalt (percent of gross sales from nickel) |
15% |
5% |
|
Production life |
30 years |
10 years |
|
Development and expansion capital |
$1,600 million |
$450 million |
|
Replacement capital per year |
$20 million |
$6 million |
|
Operating cost |
$6,000 per tonne |
$8,000 per tonne |
|
Transport, treatment and refining charges (TC/RC) |
$2,600 per tonne |
$2,600 per tonne |
|
Debt-to-equity ratio |
50% |
50% |
|
Real discount rate of equity shareholders |
8% |
8% |
|
Real interest rate on debt |
6% |
6% |
|
Inflation rate |
2% |
2% |
I applied the fiscal regimes in my sample to these mine profiles. To keep the model and my analysis as simple as possible, I did not include taxes that are likely to comprise a relatively small proportion of total government revenue for a large-scale mine, such as annual license fees. I also did not model employment taxes that are ultimately paid by the mine employees rather than the companies. I also simplified some elements of the regimes. For example, while import duties vary according to trade agreements between countries (e.g., East Africa Community trade rules) and according to the goods and services imported, I assumed one rate for all imported inputs.
Acknowledgements
The author wishes to thank Thomas Lassourd, senior policy advisor, and Viola Tarus, policy advisor for tax and extractives, at the Intergovernmental Forum on Mining, Minerals, Metals and Sustainable Development, and Amir Shafaie, Moses Kulaba, Silas Olan’g, Sophia Rwegellera and William Davis of the Natural Resource Governance Institute, for reviewing this brief. He also wishes to thank Thomas Baunsgaard, deputy division chief of the Tax Policy Division at the International Monetary Fund, and Daniel Mulé, policy lead for extractive industries, tax and transparency at Oxfam, for their input.
Notes
-
1
International Energy Agency, The Role of Critical Minerals in Clean Energy Transitions (2021), www.iea.org/reports/the-role-of-critical-minerals-in-clean-energy-transitions.
-
2
In this report we refer to both Africa north and south of the Sahara. When we mean one of the sub-regions we specify as such.
-
3
IEA (2021); Clyde Russell, “Mining is key to energy transition, but it’s still unloved,” Reuters, 11 May 2022, www.reuters.com/business/energy/mining-is-key-energy-transition-its-still-unloved-russell-2022-05-11; Jairo Yunis and Elmira Aliakbari, Annual Survey of Mining Companies 2020 (Fraser Institute, 2021), www.fraserinstitute. org/studies/annual-survey-of-mining-companies-2020.
-
4
See, for example, Natural Resource Governance Institute, Natural Resource Charter 2nd edition (2014), resourcegovernance.org/approach/natural-resource-charter.
-
5
Natural Resource Governance Institute, Resource Governance Index: From Legal Reform to Implementation in Sub-Saharan Africa (2018), resourcegovernance.org/sites/default/files/documents/rgi-from-legal-reform-to-implementation-sub-saharan-africa.pdf.
-
6
Africa Climate Foundation, Geopolitics of Critical Minerals in Renewable Energy Supply Chains (2022), africanclimatefoundation.org/news_and_analysis/geopolitics-of-critical-minerals-in-renewable-energy-supply-chains/.
-
7
See for example, Cooper Inveen, “Atlantic Lithium’s Ghana mine poised to being production by 2024,” Reuters, 20 September 2022, www.reuters.com/article/ghana-mining-lithium/atlantic-lithiums-ghana-mine-poised-to-begin-production-by-2024-idUSKBN2QV0NQ?utm_source=substack&utm_me….
-
8
As demonstrated by recent discussions between a U.S.-led group of rich countries and mineral producers such as the Democratic Republic of Congo, Namibia and Tanzania. Julian Pecquet, “US looks to Africa to
diversify supply chain for critical minerals,” The Africa Report, 23 September 2022. www.theafricareport.com/243847/us-looks-to-africa-to-diversify-supply-chain-for-critical-minerals. -
9
Glada Llahn and Paul Stevens, The curse of the one-size-fits-all fix, UNU-WIDER Working Paper (United Nations University, 2017), www.wider.unu.edu/sites/default/files/wp2017-21.pdf. For further assessment of donors’ activities in the past, both positive and negative lessons, see: Joanna Buckley, Neil McCulloch and Nick Travis, Donor-supported approaches to improving extractives governance, UNU-WIDER Working Paper (United Nations University, 2017), www.wider.unu.edu/sites/default/files/wp2017-33.pdf; Siân Herbert and Laura Bolton, Donor activity in the extractives sector (Knowledge, evidence and learning for development, 2018), opendocs.ids.ac.uk/opendocs/bitstream/handle/20.500.12413/13589/Donor_activity_in_the_extractives_sector.pdf.
-
10
Although this estimate includes emissions resulting from the investments by each group. Lucas Chancel, “Global carbon inequality over 1990–2019,” Nature Sustainability (2022), doi. org/10.1038/s41893-022-00955-z.
-
11
For Further reading on this dilemma and the arguments between the proponents of “green growth” and “degrowth, see: Alex Bowen and Samuel Fankhauser, “The Green Growth Narrative: Paradigm Shift or Just Spin? Global Environmental Change-human and Policy Dimensions,” Global Environmental Change, 21 (2021), 1157-1159, DOI: I:10.1016/j. gloenvcha.2011.07.007; Kate Raworth, Doughnut Economics: Seven Ways to Think Like a 21st Century Economist, Random House Business Books, London, 2017; Jason Hickel, “What does degrowth mean? A few points of clarification,” Globalizations, 18:7 (2021), 1105-1111, DOI: 10.1080/14747731.2020.1812222.
-
12
McKinsey & Company, “The raw-materials challenges: How the metals and mining sector will be at the core of enabling the energy transition” (2022), www.mckinsey. com/industries/metals-and-mining/our-insights/the-raw-materials-challenge-how-the-metals-and-mining-sector-will-be-at-the-core-of-enabling-the-energy-transition.
-
13
McKinsey & Company, “Metal mining constraints on the electric mobility horizon” (2018), www.mckinsey.com/industries/oil-and-gas/our-insights/metal-mining-constraints-on-the-electric-mobility-horizon.
-
14
McKinsey (2018)
-
15
NRGI analysis, based on Net Zero Tracker. “Net Zero Tracker,” Energy and Climate Intelligence Unit, Data-Driven EnviroLab, NewClimate Institute, Oxford Net Zero (2022), zerotracker.net
-
16
Pratima Desai, “Low carbon world needs $1.7 trillion in mining investment,” Reuters, 10 May 2021, www.reuters.com/business/energy/low-carbon-world-needs-17-trillion-mining-investment-2021-05-10/
-
17
Based on S&P Global Market Intelligence data and U.S. Geological Survey, Mineral Commodity Summaries 2022, 2022, www.pubs.er.usgs.gov/publication/mcs2022. These sources sometimes differ significantly. An average is taken when the reported amounts are similar. When they are not, a third source is used to determine which is likely to be more accurate.
-
18
NRGI analysis based on reserves reported in the S&P Globaldatabase and U.S. Geological Survey (2022), and the mineral volumes in a standard electric vehicle in IEA (2021).
-
19
See for example, World Bank, “New World Bank Survey Brings Hope to Malawi’s Mineral Potential,” 22 September 2015, www.worldbank.org/en/news/feature/2015/09/22/new-world-bank-survey-brings-hope-to-malawis-mineral-potential.
-
20
International Energy Agency, Global Supply Chains of EV Batteries (2022), www.iea.org/reports/global-supply-chains-of-ev-batteries.
-
21
African Minerals Development Centre (AMDC), “Unveiled: The #AMDC’s Theory of Change: A prosperous and transformed Africa achieved through sustainable development of mineral and energy resources...” Twitter post (11 October 2022), www.twitter.com/AfricanAmdc/status/1579789353584164864.
-
22
Based on S&P Global data and U.S. Geological Survey (2022). These sources sometimes differ significantly. An average is taken when the reported amounts are similar. When they are not, a third source is used to determine which is likely to be more accurate.
-
23
The correlation between exploration and mineral reserves per square kilometer is 0.79. The figure compares exploration for all metals except gold from 2002 to 2021 with current value of transition mineral reserves. Exploration spend, reserves and prices from S&P Global Market Intelligence; land area data from www.worldpopulationreview.com.
-
24
The correlation between the Resource Governance Index and Policy Potential Index scores is 0.5. The NRGI Resource Governance Index measures the transparency and accountability of mining institutions. The Policy Potential Index (PPI) in the Fraser Institute survey shows the attractiveness of a country’s policies to investors. The PPI score reported in the figure is an average of the scores from 2017 to 2021 where available, and average across jurisdictions for countries that have several. Some countries have low survey response rates, between 5 to 9 respondents. Natural Resource Governance Institute, “Resource Governance Index 2017,” 2017, resourcegovernanceindex.org; Yunis and Aliakbari (2021).
-
25
African Minerals Development Centre, Desktop Review of African Geological Survey Organisation Capacities and Gaps (United Nations Economic Commission for Africa, 2018), archive.uneca.org/publications/desktop-review-african-geological-survey-organisation-capacities-and-gaps.
-
26
Antony Sguazzin, “South Africa Sets 900 Million Annual Mineral Exploration Target,” Bloomberg, 12 April 2022, www.bloomberg.com/news/articles/2022-04-12/s-africa-sets-900-million-annual-mineral-exploration-target.
-
27
Oil exploration investment is known to correlated strongly with the quality of governance in a country, and it seems likely that a similar pattern holds for mineral exploration. See James Cust and Harding Torfinn, “Institutions and the Location of Oil Exploration”, Journal of the European Economic Association (2019).
-
28
Richard Schodde, “Key issues affecting the time delay between discovery and development – is it getting harder and longer?” PDAC 2014, 3 March 2014, Toronto. minexconsulting.com/wp-content/uploads/2019/04/Schodde-presentation-to-PDAC-March-2014.pdf
-
29
Summary of five studies. The outlier is the McKinsey study (7 to 10 years), but this was based on “large-scale greenfield assets” only. Like findings of Schodde (2021), which highlights that large projects are quicker. McKinsey (2022); IEA (2021); Tehmina Khan, Trang Nguyen, Franziska Ohnsorge, and Richard Schodde, “From Commodity Discovery to Production,” Policy Research Working Paper (World Bank, 2016); Paul Manalo, “Top mines average time from discovery to production: 16.9 years,” Metals and Mining Research S&P Global Market Intelligence (2020); Schodde (2014).
-
30
IEA (2021)
-
31
Schodde (2021) and Khan et al. (2016)
-
32
David Humphreys, “The mining industry and the supply of critical minerals,” Critical Minerals Handbook, Gus Gunn (ed.), chapter 2, 2013.
-
33
Khan et al. (2016)
-
34
Several of the experts interviewed for this report suggested that this is the main opportunity for shortening lead times.
-
35
David Manley, Patrick R.P. Heller and William Davis, No Time to Waste: Governing Cobalt Amid the Energy Transition (Natural Resource Governance Institute, 2022), resourcegovernance.org/no-time-to-waste-governing-cobalt-amid-energy-transition.
-
36
Matt Renaud and Mustafa Kumral, “Out of the Comfort Zone: Quantifying Country Risk for Foreign Mining Project Investment Feasibilities,” Mining, Metallurgy & Exploration, 38, 2323-2335 (2021), www.doi.org/10.1007/s42461-021-00495-8.
-
37
Based on S&P Global data and U.S. Geological Survey (2022). These sources sometimes differ significantly. An average is taken when the reported amounts are similar. When they are not, a third source is used to determine which is likely to be more accurate.
-
38
Henry Sanderson, “Vedanta starts arbitration against Zambia after mines seized,“ Financial Times, 31 May 2019. www.ft.com/content/98b0c464-83a1-11e9-b592-5fe435b57a3b.
-
39
Julia Tilley, “Labour talks 217: Escondida and other stories,” S&P Global Market Intelligence, Metals and Mining Research, 23 February 2017.
-
40
Keval Dhokia, “Global copper pipeline challenged due to disruption,” S&P Global Market Intelligence, Metals and Mining Research, 18 June 2019.
-
41
Sudarshan Varadhan, “Indian state seeks permanent closure of Vedanta’s copper smelter: officials,” Reuters, 24 May 2018. www.reuters.com/article/us-vedanta-smelter-idUSKCN1IP1CX.
-
42
Dhokia (2019)
-
43
Misha Savic, Jan Bratanic and Thomas Biesheuvel, “Europe’s Biggest Lithium Mine Blocked as Rio Loses in Serbia,” Bloomberg, 20 January 2022, www.bloomberg.com/news/articles/2022-01-20/serbia-suspends-rio-tinto-s-2-4-billion-lithium-mine-project.
-
44
Tanzania Minerals Audit Agency, A Study on Viability to Construct a Copper Concentrate Smelter in Tanzania (2011), www.scribd.com/document/193187016/A-Study-on-Viability-to-Construct-a-Copper-Concentrate-Smelter-in-Tanzania1.
-
45
Africa Confidential, “Local processing row holds up rare earth mine,” 25 October 2022, www.africa-confidential.com/article-preview/id/14166/Local_processing_row_holds_up_rare_earth_mine.
-
46
Reuters, “Timeline: The battle for Simandou,” 22 January 2021, www.reuters.com/article/us-swiss-steinmetz-timeline-idUSKBN29R2AA.
-
47
Magnus Ericsson and Olof Löf, “Mining’s contribution to national economies between 1996 and 2016,” Mineral Economics, 223–250 (2019), doi.org/10.1007/s13563-019-00191-6.
-
48
Net savings plus education expenditure and minus energy depletion, mineral depletion, net forest depletion, and carbon dioxide and particulate emissions damage. NRGI analysis of World Bank, “World Development Indicators,” accessed 28 September 2022, www.databank.worldbank.org/source/world-development-indicators.
-
49
Anthony J. Venables, “Using Natural Resources for Development: Why Has It Proven So Difficult?” Journal of Economic Perspectives, 30:1, 161–184 (2016) doi. org/10.1257/jep.30.1.161.
-
50
Giorgia Albertin, Boriana Yontcheva, Dan Devlin, Hilary Devine, Marc Gerard, Sebastian Beer, Irena Jankulov Suljagic and Vimal V. Thakoor, Tax Avoidance in Sub-Saharan Africa’s Mining Sector, Departmental Paper No 2021/022 (International Monetary Fund, 2021), www.imf.org/en/Publications/Departmental-Papers-Policy-Papers/Issues/2021/09/27/Tax-Avoidance-in-Sub-Saharan-Africas-Mining-Sector-464850
-
51
See for example, South African Human Rights Commission, National Hearing on the Underlying Socio-economic Challenges of Mining-affected Communities in South Africa (2016), www.sahrc.org.za/home/21/files/SAHRC%20Mining%20communities%20report%20FINAL.pdf
-
52
See, for example, Claude Kabemba, “How mineral resources can fuel the development of Africa in the context of post-Covid economic recovery,” Publish What You Pay Annual Conference, 14-15 March 2021, www.sarwatch.co.za/how-mineral-resources-can-fuel-the-development-of-africa-in-the-context-of-post-covid-economic-recovery.
-
53
See, for example, African Development Bank, Request for Expressions of Interest, 2022, www.afdb.org/sites/default/files/reoi_green_minerals_strategy_approach_paper_002.pdf.
-
54
Other partners currently include African Legal Support Facility, Africa Finance Corporation, Afreximbank, United Nations Economic Commission for Africa and United Nations Development Programme.
-
55
African Development Bank, “Why Africa is the next renewables powerhouse,” 7 December 2018, www.afdb.org/en/news-and-events/why-africa-is-the-next-renewables-powerhouse-18822
-
56
Manley et al (2022)
-
57
Through Power Africa (www.usaid.gov/powerafrica), for example.
-
58
Reserves data is from S&P Global Market Intelligence and U.S. Geological Survey. The above ground assets of a country comprise its power and transport infrastructure, human capital and other productive capabilities, level of environmental protection and investment climate. They have been converted to a regional index of 0-100.
The data is from multiple sources: African Development Bank, The Africa Infrastructure Development Index (AIDI) 2020, 2020, www.afdb.org/en/documents/economic-brief-africa-infrastructure-development-index-aidi-2020-july-2020; World Bank, “World Development Indicators”; African Development Bank, Electricity Regulatory Index (ERI) for Africa, 2021, 2021, africa-energy-portal.org/reports/electricity-regulatory-index-eri-africa-2021-edition; World Intellectual Property Organization, Global Innovation Index (GII) 2021, 2021, www.wipo.int/publications/en/details.jsp?id=4560; Harvard Growth Lab, “The Atlas of Economic Complexity,” accessed 20 September 2022, www.atlas.cid.harvard.edu/; Environmental Protection Index, “2022 Environmental Protection Index (2022),” accessed 20 September 2022, www.epi.yale.edu/; World Bank, “Doing Business 2020,” accessed 20 September 2022, www.worldbank.org/en/programs/business-enabling-environment/doing-business-legacy; S&P Global, “Control Risks Country Risk Summary,” accessed 20 September 2022, www.capitaliq.spglobal.com. -
59
Southern African Development Community and African Minerals Development Centre, Developing a Regional Mining Vision for the Southern African Development Community (SADC), 2018.
-
60
Manley et al (2022)
-
61
Emily Hersh, Alex Grant and Chris Berry, So, You Want to make Batteries Too? (Payne Institute, 2020), www.payneinstitute.mines.edu/so-you-want-to-make-batteries-better-too
-
62
Ibid.
-
63
See for example, African Development Bank, Lithium-Cobalt Value Chain Analysis for Mineral Based Industrialization in Africa (2021), www.afdb.org/en/documents/lithium-cobalt-value-chain-analysis-mineral-based-industrialization-Africa.
-
64
McKinsey & Company, Power to move: Accelerating the electric transport transition in sub-Saharan Africa (2022), www.mckinsey.com/industries/automotive-and-assembly/our-insights/power-to-move-accelerating-the-electric-transport-transition-in-sub- aharan-africa.
-
65
BloombergNEF, The Cost of Producing Battery Precursors in the DRC (2021), about. bnef.com/blog/producing-battery-materials-in-the-drc-could-lower-supply-chain-emissions-and-add-value-to-the-countrys-cobalt.
-
66
Mohua Mukherjee, India’s Mass-Market Clean Mobility Initiatives and its Unique, Customized Business Models for Light Electric Vehicles (The Oxford Institute for Energy Studies, 2022), www.oxfordenergy.org/publications/indias-mass-market-clean-mobility-initiatives-and-its-unique-customized-business-models-for-light-electric-vehicles.
-
67
Rwanda Ministry of Infrastructure, Strategic Paper on Electric Mobility Adaption in Rwanda (2021), www.mininfra.gov.rw/fileadmin/user_upload/Mininfra/Publications/Laws_Orders_and_Instructions/Transport/16062021_Strategic_Paper_for_e-mobility_adapta….
-
68
Manley et al (2022)
-
69
IEA (2022)
-
70
See for example World Gold Council, Responsible gold mining and value distribution, 2013 report (2013), www.gold.org/goldhub/research/responsible-gold-mining-and-value-distribution-2013-report.
-
71
World Gold Council (2013). Mining Shared Value has indicated these figures are representative of wider sector trends.
-
72
Jeff Geipel, Mining Shared Value, interview with authors, 25 September 2022.
-
73
Government of Canada, “Minerals Sector Employment,” January 2019, www.nrcan.gc.ca/science-data/science-research/earth-sciences/earth-sciences-resources/earth-sciences-federal-programs/minerals-sector-employment/16739; Mets Ignited, “METS in Australia,” accessed 28 September 2022, www.metsignited.org/australian-mets-sector/.
-
74
Aaron Cosbey and Isabelle Ramdoo, Guidance for Governments: Local Content Policies (Intergovernmental Forum on Mining, Minerals, Metals and Sustainable Development, 2018), igf-guidance-for-governments-local-content.pdf; International Finance Corporation, Guide to Getting Started in Local Procurement (2011), www.ifc.org/wps/wcm/connect/topics_ext_content/ifc_external_corporate_site/sustainability-at-ifc/publications/publications_handbook_guidetogettingsta…; Mining Shared Value and Engineers Without Borders, The Mining Local Procurement Reporting Mechanism (LPRM) (2017), www.miningsharedvalue.org/mininglprm.
-
75
See for example, activities of the Industrial Development Corporation (www.idc.co.za) and Anglo American’s Zimele programs (www.southafrica.angloamerican.com/our-difference/zimele)
-
76
Southern Africa Resource Watch, From Harmonisation of Policies to the Manufacturing of Lithium Batteries in Southern Africa: Collaboration between DRC and Zambia (2022), www.sarwatch.co.za/publication/from-harmonisation-of-policies-to-the-manufacturing-of-lithium-batteries-in-southern-africa-collaboration-between-drc-….
-
77
Jeff Geipel, Mining Shared Value, interview with authors, 25 September 2022.
-
78
Giorgia Albertin et al (2021). Note that the definition of mineral-dependent does not overlap with which countries have substantial reserves of transition minerals.
-
79
Ibid. The IMF estimates the 15 mineral-rich countries earned mining revenues equals 2 percent of GDP on average. This amounts to $13 billion a year.
-
80
For example, if companies were to adhere to more responsible tax practices such as the B Team Responsible Tax Principles. See The B Team, “Advancing Responsible Tax Practice,” accessed 28 September 2022, www.bteam.org/our-work/causes/governance/advancing-responsible-tax-practice.
-
81
Yannick Bouterige, Céline de Quatrebarbes and Bertrand Laporte, Mining Taxation in Africa: What Evolution in 2018? (International Centre for Tax and Development, 2020), www.ictd.ac/publication/mining-taxation-africa-recent-evolution.
-
82
Giorgia Albertin et al (2021).
-
83
For example, a study of contracts on resourcecontracts.org revealed that Burkina Faso, Burundi, Guinea, Madagascar and Mali had agreed stabilization clauses lasting 30- 34 years on average—significantly longer than necessary to ensure the bankability of projects. Intergovernmental Forum on Mining, Minerals, Metals and Sustainable Development, Insights on Incentives: Tax Competition in Mining (2019), www.iisd.org/sites/default/files/publications/insights-incentives-tax-competition-mining.pdf; Natural Resource Governance Institute, resourcecontracts.org.
-
84
NRGI analysis using S&P Global mineral reserves and price data. Prices are near-term forecasts and therefore may be elevated compared to the longer-term trend.
-
85
NRGI analysis. On average, 16 percent of mining sales revenue has gone to tax payments. See Robert Pitman and Kaisa Toroskainen, Beneath the surface: The Case for Oversight of Extractive Industry Suppliers (Natural Resource Governance Institute, 2020) resourcegovernance.org/analysis-tools/publications/beneath-surface-oversight-extractive-industry-suppliers.
This figure aligns with estimates in other studies: Olle Östensson, Local content, supply chains, and shared infrastructure, UNU-WIDER Working Paper (United Nations University, 2017), www.researchgate.net/publication/337699966_Local_content_supply_chains_and_shared_infrastructure; Price Waterhouse Coopers, Total Tax Contribution: A study of the economic contribution mining companies make to public finances (2010), www.pwc.co.uk/assets/pdf/ttc-mining-study-1.pdf. -
86
Anthony J. Venables (2016) and Natural Resource Governance Institute (2014).
-
87
NRGI (2017), “Resource Governance Index 2017.” There was a small improvement in a smaller sample of countries covered by the 2021 edition of the Resource Governance Institute.
-
88
Anna Fleming, Thomas Lassourd and David Manley, “Variable Royalties: an Answer to Volatile Mineral Prices?” in Handbook on the Future of Resource Taxation, African Tax Administration Forum and Intergovernmental Forum on Mining, Minerals, Metals and Sustainable Development (forthcoming),www.iisd.org/publications/brief/future-resource-taxation-roadmap.
-
89
Robert Pitman, “Contract Disclosure Policy and Practice Tracker,” accessed 15 October 2022, docs.google.com/spreadsheets/d/1FXEeD43jw6VYHV8yS-8KJ5-rR5l0XtKxVQZBWzr-ohY.
-
90
Based on membership of the Extractive Industries Transparency Initiative (www.eiti.org/countries).
-
91
Natural Resource Governance Institute, “Chile country profile,” accessed 5 October 2022, www.resourcegovernanceindex.org/country-profiles/CHL/mining.
-
92
Transparency International, “Corruption Perceptions Index 2021,” www.transparency.org/en/cpi/2021.
-
93
United Nations Office on Drugs and Crime, Corruption and Sustainable Development (no date), www.anticorruptionday.org/documents/actagainstcorruption/print/corr18_fs_DEVELOPMENT_en.pdf
-
94
K.C. Michaels, Louis Maréchal and Benjamin Katz, “Why is ESG so important to critical mineral supplies, and what can we do about it?” (International Energy Agency, 2022) www.iea.org/commentaries/why-is-esg-so-important-to-critical-mineral-supplies-and-what-can-we-do-about-it
-
95
Extractive Industries Transparency Initiative, Making the grade: Strengthening governance of critical minerals, www.eiti.org/documents/strengthening-governance-critical-minerals.
-
96
Extractive Industries Transparency Initiative, EITI Standard 2019, eiti.org/collections/ eiti-standard#EITI-Requirements-2019; Organisation for Economic Co-operation and Development, OECD Due Diligence Guidance for Responsible Supply Chains of Minerals from Conflict-Affected and High-Risk Areas (2016), www.oecd.org/daf/inv/mne/OECD-Due-Diligence-Guidance-Minerals-Edition3.pdf; Alexandra Gillies, Sebastian Sahla, Matthieu Salomon and Tom Shipley, Diagnosing Corruption in the Extractive Sector: A Tool for Research and Action (Natural Resource Governance Institute, 2021) www.resourcegovernance.org/analysis-tools/publications/diagnosing-corruption-extractive-sector-tool-research-and-actionrespectively.
-
97
Colombia National Mining Agency, Management and Corruption Risk Matrices of the ANM approved by the Institutional Management
and Performance Committee on 01/27/2022 (2022), www.anm.gov.co/?q=documentos_para_comentarios_ciudadania; Robert Pitman and Kaisa Toroskainen, “BHP, Others Increase Scrutiny of Subcontracting Corruption Risks” (Natural Resource Governance Institute, 2018) www.resourcegovernance.org/blog/bhp-others-increase-scrutiny-subcontracting-corruption-risks. -
98
Alexandra Gillies, “Will Extractive Companies Move Away from Corruption- Prone Intermediaries?”, (Natural Resource Governance Institute, 2019) www.resourcegovernance.org/blog/extractive-companies-corruption-intermediaries-middlemen-oil.
-
99
Natural Resource Governance Institute, Anticorruption Guidance for Partners of State-Owned Enterprises (2022), soe-anticorruption.resourcegovernance.org/chapters/avoiding-high-risk-agents
-
100
Favour Ime and Louise Russell-Prywata, “Beneficial ownership transparency and the fight against grand corruption in Nigeria” (Open Ownership, 2022), www.openownership.org/en/blog/beneficial-ownership-transparency-and-the-fight-against-grand-corruption-in-nigeria.
-
101
Nqobile Dludla, “South Africa mine dam wall collapses, Killing 1 and injuring 40,” Reuters, 11 September 2022, www.reuters.com/world/africa/south-africa-mine-dam-wall-collapses-killing-three-injuring-40-2022-09-11.
-
102
Kirsten Hund and Erik Reed, “A low-carbon future must protect the world’s forests” (World Bank, 2019), www.blogs.worldbank.org/voices/low-carbon-future-must-protect-worlds-forests.
-
103
NRGIcalculationsusingscope1,2and3 emissions (excluding fugitive methane and emissions from the combustion of coal) reported by Lindsay Delevingne, Will Glazener, Liesbet Grégoir and Kimberly Henderson, “Climate risk and decarbonisation: What every mining CEO needs to know,” McKinsey & Company, 2020 www.mckinsey.com/business-functions/sustainability/our-insights/climate-risk-and-decarbonization-what-every-mining-ceo-needs-to-know. Total global emissions are for 2019 from Climate Watch, “Global Historical Emissions,” accessed 18 September 2022, www.climatewatchdata.org/ghg-emissions?end_year=2019&start_year=1990.
-
104
See for example, Éléonore Lèbre, Martin Stringer, Kamila Svobodova, John R. Owen, Deanna Kemp, Claire Côte, Andrea Arratia-Solar and Rick K. Valenta, “The social and environmental complexities of extracting energy transition metals,” Nature Communications, 11: 4823 (2020), www.nature.com/articles/s41467-020-18661-9#MOESM1.
-
105
IEA (2021)
-
106
Ibid.
-
107
World Bank, “Climate Change Knowledge Portal,” accessed 28 September 2022, www.climateknowledgeportal.worldbank.org.
-
108
NRGI (2017)
-
109
Cameroon is one exception, with its new cadastre system preventing licenses being granted that overlap protected areas. Several companies also have a no-go policy, though only for World Heritage sites. See for example ICMM, “ICMM calls for stronger legal protection of World Heritage Sites,” 2016, www.icmm.com/en-gb/news/2016/icmm-calls-for-protection-of-world-heritage-sites.
-
110
Abbi Buxton, People and nature first: safeguards needed in mining exploration (International Institute for Environment and Development, 2021) www.iied.org/20736iied.
-
111
See for example in Colombia: Lorenzo Cotula, Investment disputes from below: whose rights matter? (International Institute for Environment and Development, 2020), www.iied.org/investment-disputes-below-whose-rights-matter.
-
112
Nicola Woodroffe and Tim Grice, Beyond Revenues: Measuring and Valuing Environmental and Social Impacts in Extractive Sector Governance (Natural Resource Governance Institute, 2019), www.resourcegovernance.org/analysis-tools/publications/beyond-revenues-measuring-environmental-social-impacts.
-
113
IFC, E&S Performance Standards (2012), www.ifc.org/wps/wcm/connect/topics_ext_content/ifc_external_corporate_site/sustainability-at-ifc/policies-standards/performance-standards; IGF, Environmental and Social Impact Assessments (2020), www.igfmining.org/our-work/environmental-and-social-impact-assessments.
-
114
Daniel Whyte, “Forest finance: how Gabon earned the first payment for conservation in Africa,” Climate Tracker, 8 December 2021, www.climatetracker.org/forest-protection-first-payment-gabon-africa.
-
115
See for example Taako Edema George, Kiemo Karatu, and Andama Edward, “An evaluation of the environmental impact assessment practice in Uganda: challenges and opportunities for achieving sustainable development,” Heliyon 6(9), 2020, www.ncbi.nlm.nih.gov/pmc/articles/PMC7505666.
-
116
See for example Organisation for Economic Co-operation and Development, Guiding Principles for Durable Extractive Contracts (2019), www.oecd.org/dev/Guiding_Principles_for_durable_ extractive_contracts.pdf; United Nations Human Rights Office
of the High Commissioner, Principles for Responsible Contracts: Integrating the Management of Human Rights Risks into State-Investor Contract Negotiations- Guidance for Negotiators (2015), www.ohchr.org/%20Documents/Publications/Principles_ResponsibleContracts_HR_PUB_15_1_EN.pdf; and NRGI (2014). -
117
See for example Reuters, “South Africa’s Gold Fields bets on solar to cut costs and carbon,” 13 October 2022, www.reuters.com/business/sustainable-business/south-africas-gold-fields-bets-solar-cut-costs-carbon-2022-10-13.
-
118
U.N. Climate Change Conference UK 2021, “Glasgow Leaders’ Declaration on Forests and Land Use,” 2021, ukcop26.org/glasgow-leaders-declaration-on-forests-and-land-use.
-
119
Frances Seymour, Tony La Vina and Kristen Hite, Evidence linking community-level tenure and forest condition: An annotated bibliography (Climate and Land Use Alliance, 2015), www.climateandlandusealliance.org/wp-content/uploads/2015/08/Community_level_tenure_and_forest_condition_bibliography.pdf.
-
120
Peter G. Veit, “9 Facts about Community Land and Climate Mitigation” (World Resources Institute, 2021) files.wri.org/d8/s3fs-public/2021-10/9-facts-about-community-land-and-climate-mitigation.pdf.
-
121
Development Bank of Southern Africa, African Environmental Assessment Legislation Handbook: Consultation Draft, 2021, www.dbsa.org/african-environmental-assessment-legislation-handbook.
-
122
United Nations Development Programme, Participatory Environmental Monitoring Committees in Mining Contexts, 2019, www.undp.org/publications/participatory-environmental-monitoring-committees-mining-contexts.
-
123
Jonathan Watts, “Murders of environment and land defenders hit record high,” The Guardian, 13 September 2021, www.theguardian.com/environment/2021/sep/13/murders-environment-land-defenders-record-high.
-
124
NRGI (2017), “Resource Governance Index 2017.” There was a small improvement in a smaller sample of countries covered by the 2021 edition of the Resource Governance Institute.
-
125
With a gold price of USD 1,600 per ounce.
-
126
With a low-profit mine and a gold price of $1,600 per ounce.
-
127
Cecilia Jamasmie, “Petra Diamonds’ stake in Williamson to shrink as part of deal with Tanzania,” Mining.com, 13 December 2021, www.mining.com/petra-diamonds-stake-in-williamson-to-shrink-as-part-of-deal-with-tanzania.
-
128
Lifezone Metals, “Kabanga Nickel Signs Framework Agreement,” 19 January 2021, www.lifezonemetals.com/kabanga-nickel-signs-framework-agreement.
-
129
Thomas Scurfield and Silas Olan’g, “Magufuli Seeks the Right Balance for Tanzania’s Mining Fiscal Regime,” NRGI, 31 January 2019, www.resourcegovernance.org/blog/magufuli-seeks-right-balance-tanzania-mining-fiscal; Thomas Scurfield, “Tanzania Strikes a Better Balance with its Mining Fiscal Regime,” NRGI, 24 June 2020, www.resourcegovernance.org/blog/tanzania-strikes-better-balance-mining-fiscal-regime.
-
130
This framework agreement was published in a document setting out Barrick’s offer to buy the shares it did not already own in Acacia Mining, the previous owner of the Bulyanhulu, Buzwagi and North Mara mines in Tanzania. See Acacia Mining and Barrick Gold, Recommended Final Offer for Acacia Mining Plc by Barrick Gold Corporation, 2019, 66–79, s25.q4cdn.com/322814910/files/doc_downloads/acacia/Acacia-2.7-announcement.pdf.
-
131
The main revenue streams are import duty, skills development levy, royalty, corporate income tax, a share of dividends and shareholder loan repayments through state equity, and dividend withholding tax.
-
132
The earlier in time a shilling (Tanzania’s official currency unit) is received, the more it is worth. This is, first, because it can be used earlier; and second, because the future is uncertain, and no one can be sure they will receive that shilling in the future. To account for this time value of money, a “discount rate” is applied. In the sharing arrangement, this would mean that if the government received a shilling in year 1, the company would need to receive more than a shilling in year 2 for the benefits to be comparable. However, given cumulation here is based on actual cash flow, the company would need to receive only a shilling in year 2 for the benefits to be shared equally.
-
133
This provision for the company to earn its minimum return before sharing is triggered means Ecuador’s mechanism is similar to an R-based cash flow tax, commonly referred to as a Brown Tax. See, e.g., Robin Broadway and Michael Keen, “Theoretical perspectives on resource tax design,” in The Taxation of Petroleum and Minerals: Principles, Problems and Practice, edited by Philip Daniel, Michael Keen and Charles McPherson (Oxford: Routledge, 2010), 13–74.
-
134
Prices are taken from World Bank, “Commodities Price Data (The Pink Sheet),” www.worldbank.org/en/research/commodity-markets.
-
135
With a gold price of $1,600 per ounce.
-
136
With a gold price of $1,600 per ounce.
-
137
With a gold price of $1,600 per ounce.
-
138
The Fraser Institute survey estimates that, unless there are extremely harmful policies, around 60 percent of an investment decision tends to be based on a country’s geology. The other 40 percent comprises of several other factors, including political stability and policy predictability (given they affect the risk that investors will not be able to secure future returns generated by their investments), a conducive business environment and the tax level. See Julio Mejia and Elmira Aliakbari, Fraser Institute Annual Survey of Mining Companies 2022, (Fraser Institute, 2023), 8, www.fraserinstitute.org/studies/annual-survey-of-mining-companies-2022.
-
139
However, information gaps make it difficult for taxes to be structured to capture all excess profit. See Jean-Franҫois Wen, Progressive Taxation of Extractive Resources as Second-Best Optimal Policy (International Monetary Fund, 2018), www.imf.org/en/Publications/WP/Issues/2018/06/13/Progressive-Taxation-of-Extractive-Resources-as-Second-Best-Optimal-Policy-45923.
-
140
Recent research provides a sense of the potential revenue loss to governments from tax avoidance. The International Monetary Fund recently estimated that sub-Saharan African mining countries could be losing between $450 and $730 million in corporate income tax a year. See Sebastian Beer and Dan Devlin, Is There Money on the Table? Evidence on the Magnitude of Profit Shifting in the Extractive Industries (International Monetary Fund, 2021), www.imf.org/en/Publications/WP/Issues/2021/01/15/Is-There-Money-on-the-Table-Evidence-on-the-Magnitude-of-Profit-Shifting-in-the-Extractive-49983.
-
141
It is perhaps surprising that Tanzania’s 50-50 sharing arrangement generates an AETR greater than 50 percent (with a discount rate of 10 percent). This is despite AETR measuring government take as the share of pre-tax profits, which is larger than “economic benefits” (given economic benefits exclude interest payments). This outcome results from the 50-50 split being based on actual cash flow. The government receives revenue before the mining company through input and production taxes that do not depend on the mine making a profit. Because of these earlier revenues, the government receives a larger share on a discounted basis.
-
142
As reported in the S&P Global database. Legal risks are “expropriation, state contract alteration and contract enforcement risks.” Tax risks are “tax increase and tax inconsistency risks.” Control Risks scores these risks as still “very high” and “high” respectively (following Tanzania’s overhaul of extractives sector laws and other actions against existing mines in 2017) but reducing.
-
143
With a discount rate of 10 percent. While Ecuador’s sharing mechanism does not account for the labor profit share because none of it will go to the government from 2024 onwards, I have included it in the AETR because it is a tax on the project. The Democratic Republic of Congo regime has an excess profits tax that is triggered for a mine when the realized price is at least 25 percent higher than the price in its feasibility study. I assumed that the feasibility study has a price of $1,300 per ounce, so the excess profits tax is not triggered.
-
144
Total benefits in this case are a project’s revenues minus operating costs and replacement capital (but not minus exploration and development capital). This cash flow represents the money available to pay back the initial investment and provide a return. The government share of it is a common measure of progressivity.
-
145
Wen, Progressive Taxation of Extractive Resources as Second-Best Optimal Policy.
-
146
With a discount rate of 10 percent. The results for only some countries are shown to clearly depict each data point. The results for all the evaluated countries can be found in my model.
-
147
Scurfield, “Tanzania Strikes a Better Balance with its Mining Fiscal Regime.”
-
148
This feature is not fully reflected in Figure 5 given that “total benefits” use a slightly different definition of profits and are based on discounted cash flows.
-
149
With a gold price of $1,600 per ounce.
-
150
For example, an average 62 percent of respondents to the Fraser Institute surveys between 2017 and 2019 said the current implementation of Tanzania’s legal system would strongly discourage investment, and 73 percent said regulatory uncertainty would. See, e.g., Ashley Stedman, Jairo Yunis and Elmira Aliakbari, Fraser Institute Annual Survey of Mining Companies 2019 (Fraser Institute, 2020), www.fraserinstitute.org/studies/annual-survey-of-mining-companies-2019.
-
151
With a low-profit mine and a gold price of $1,600 per ounce.
-
152
Tax avoidance could extend the Philippines’ recovery period, and therefore delay the payment of some taxes including import duty and interest withholding tax, given the end of the recovery period depends on the reported profitability of a mine rather than an ex-ante assessment. However, the rule that the recovery period must end five years from the start of production regardless of whether pre-production expenses have been recouped limits the extent to which it can be extended.
-
153
The merits of these measures require further scrutiny. E.g., taking a share of loan repayments could result in lenders charging a higher interest rate to ensure they still recoup their loan and a minimum return. This would not only reduce taxable income but also make it harder for the government to assess whether an interest rate is reasonable, because it would not be comparable with industry benchmarks. It can also be difficult for a government to always determine whether a loan is from a related party or not. However, these considerations are outside the scope of this analysis.
-
154
Natural Resource Governance Institute (NRGI), Natural Resource Charter, 2nd edition, 2014, resourcegovernance.org/analysis-tools/publications/natural-resource-charter-2nd-ed.
-
155
Although its exclusion of several significant taxes from the government’s share of benefits means low-profit mines may still be impacted.
-
156
With a gold price of $1,600 per ounce.
-
157
Anna Fleming, Thomas Lassourd and David Manley, “Variable Royalties: an Answer to Volatile Mineral Prices?” in Handbook on the Future of Resource Taxation, African Tax Administration Forum and Intergovernmental Forum on Mining, Minerals, Metals and Sustainable Development (forthcoming), www.iisd.org/publications/brief/future-resource-taxation-roadmap.
-
158
Ensuring that interest rates used as a comparison apply to comparable assets with a similar risk profile is challenging, but rules of this nature have been successful in reducing profit shifting in other countries. See Beer and Devlin, Is There Money on the Table?.
-
159
The main taxes listed are VAT, royalty and corporate income tax. The regime also includes a share of pre-tax profits that is currently divided between the company’s workers and the government, with the portion received by the government included in its accumulated benefits. However, a recent court ruling means that all this labor profit share will go to workers from the start of 2024 and therefore none of it will be included in government benefits.
-
160
The discount rate used is specific to each mine and based on its weighted average cost of capital (WACC). I have assumed that WACC is around 7 percent in real terms. This is based on the typical discount rate for equity shareholders used by industry and government analysts of 8 percent in real terms, and the current average cost of debt for the mining sector as reported by Aswath Damodaran, Damodaran Online, www.pages.stern.nyu.edu/~adamodar.
-
161
Republic of the Philippines, Financial or Technical Assistance Agreement, mgb.gov.ph/attachments/article/79/PFC_FTAA.pdf.
-
162
For example, some terms in the original FTAA for an OceanaGold mine differed in some areas: Republic of the Philippines, Financial or Technical Assistance Agreement with Arimco Mining Corporation, 1994, www.resourcecontracts.org/contract/ocds-591adf-2792396017. I understand that the recently signed extension to this agreement has slightly different terms again.
-
163
A template of the FARI model and a user guide that explains all the concepts and workings of the model are available at International Monetary Fund, “Fiscal Analysis of Resource Industries,”www.imf.org/external/np/fad/fari.
The Future of Resource Taxation: 10 Policy Ideas to Mobilize Mining Revenues
The mining sector is at the nexus of important global phenomena: climate change and the push to transition to low-carbon energy, the development of new technologies affecting labour markets, and global momentum against inequality and for tax reforms. These trends are raising the importance of mining for both its mineral and financial outputs. In this context, governments need new and innovative fiscal measures to protect the public’s financial interests during the next generation of resource extraction.
The Intergovernmental Forum on Mining, Minerals, Metals and Sustainable Development (IGF) partnered with the African Tax Administration Forum (ATAF) to rethink how developing countries benefit financially from their mineral resources. They launched The Future of Resource Taxation in 2020, a research project to discover how the existing system of mining taxation can be improved and identify new, innovative fiscal options for resource-rich countries to maximize the returns from their mineral wealth. The project crowdsourced and developed policy ideas from governments, civil society, academia, and industry. The end result is the IGF's handbook for policy-makers: The Future of Resource Taxation: 10 Policy Ideas to Mobilize Mining Revenues. It presents a menu of innovative fiscal measures to strengthen revenue collection in the mining sector.
Current and former NRGI team members were among many experts who contributed to this volume.
Notes
-
1
International Energy Agency, The Role of Critical Minerals in Clean Energy Transitions (2021), www.iea.org/reports/the-role-of-critical-minerals-in-clean-energy-transitions.
-
2
In this report we refer to both Africa north and south of the Sahara. When we mean one of the sub-regions we specify as such.
-
3
IEA (2021); Clyde Russell, “Mining is key to energy transition, but it’s still unloved,” Reuters, 11 May 2022, www.reuters.com/business/energy/mining-is-key-energy-transition-its-still-unloved-russell-2022-05-11; Jairo Yunis and Elmira Aliakbari, Annual Survey of Mining Companies 2020 (Fraser Institute, 2021), www.fraserinstitute. org/studies/annual-survey-of-mining-companies-2020.
-
4
See, for example, Natural Resource Governance Institute, Natural Resource Charter 2nd edition (2014), resourcegovernance.org/approach/natural-resource-charter.
-
5
Natural Resource Governance Institute, Resource Governance Index: From Legal Reform to Implementation in Sub-Saharan Africa (2018), resourcegovernance.org/sites/default/files/documents/rgi-from-legal-reform-to-implementation-sub-saharan-africa.pdf.
-
6
Africa Climate Foundation, Geopolitics of Critical Minerals in Renewable Energy Supply Chains (2022), africanclimatefoundation.org/news_and_analysis/geopolitics-of-critical-minerals-in-renewable-energy-supply-chains/.
-
7
See for example, Cooper Inveen, “Atlantic Lithium’s Ghana mine poised to being production by 2024,” Reuters, 20 September 2022, www.reuters.com/article/ghana-mining-lithium/atlantic-lithiums-ghana-mine-poised-to-begin-production-by-2024-idUSKBN2QV0NQ?utm_source=substack&utm_me….
-
8
As demonstrated by recent discussions between a U.S.-led group of rich countries and mineral producers such as the Democratic Republic of Congo, Namibia and Tanzania. Julian Pecquet, “US looks to Africa to
diversify supply chain for critical minerals,” The Africa Report, 23 September 2022. www.theafricareport.com/243847/us-looks-to-africa-to-diversify-supply-chain-for-critical-minerals. -
9
Glada Llahn and Paul Stevens, The curse of the one-size-fits-all fix, UNU-WIDER Working Paper (United Nations University, 2017), www.wider.unu.edu/sites/default/files/wp2017-21.pdf. For further assessment of donors’ activities in the past, both positive and negative lessons, see: Joanna Buckley, Neil McCulloch and Nick Travis, Donor-supported approaches to improving extractives governance, UNU-WIDER Working Paper (United Nations University, 2017), www.wider.unu.edu/sites/default/files/wp2017-33.pdf; Siân Herbert and Laura Bolton, Donor activity in the extractives sector (Knowledge, evidence and learning for development, 2018), opendocs.ids.ac.uk/opendocs/bitstream/handle/20.500.12413/13589/Donor_activity_in_the_extractives_sector.pdf.
-
10
Although this estimate includes emissions resulting from the investments by each group. Lucas Chancel, “Global carbon inequality over 1990–2019,” Nature Sustainability (2022), doi. org/10.1038/s41893-022-00955-z.
-
11
For Further reading on this dilemma and the arguments between the proponents of “green growth” and “degrowth, see: Alex Bowen and Samuel Fankhauser, “The Green Growth Narrative: Paradigm Shift or Just Spin? Global Environmental Change-human and Policy Dimensions,” Global Environmental Change, 21 (2021), 1157-1159, DOI: I:10.1016/j. gloenvcha.2011.07.007; Kate Raworth, Doughnut Economics: Seven Ways to Think Like a 21st Century Economist, Random House Business Books, London, 2017; Jason Hickel, “What does degrowth mean? A few points of clarification,” Globalizations, 18:7 (2021), 1105-1111, DOI: 10.1080/14747731.2020.1812222.
-
12
McKinsey & Company, “The raw-materials challenges: How the metals and mining sector will be at the core of enabling the energy transition” (2022), www.mckinsey. com/industries/metals-and-mining/our-insights/the-raw-materials-challenge-how-the-metals-and-mining-sector-will-be-at-the-core-of-enabling-the-energy-transition.
-
13
McKinsey & Company, “Metal mining constraints on the electric mobility horizon” (2018), www.mckinsey.com/industries/oil-and-gas/our-insights/metal-mining-constraints-on-the-electric-mobility-horizon.
-
14
McKinsey (2018)
-
15
NRGI analysis, based on Net Zero Tracker. “Net Zero Tracker,” Energy and Climate Intelligence Unit, Data-Driven EnviroLab, NewClimate Institute, Oxford Net Zero (2022), zerotracker.net
-
16
Pratima Desai, “Low carbon world needs $1.7 trillion in mining investment,” Reuters, 10 May 2021, www.reuters.com/business/energy/low-carbon-world-needs-17-trillion-mining-investment-2021-05-10/
-
17
Based on S&P Global Market Intelligence data and U.S. Geological Survey, Mineral Commodity Summaries 2022, 2022, www.pubs.er.usgs.gov/publication/mcs2022. These sources sometimes differ significantly. An average is taken when the reported amounts are similar. When they are not, a third source is used to determine which is likely to be more accurate.
-
18
NRGI analysis based on reserves reported in the S&P Globaldatabase and U.S. Geological Survey (2022), and the mineral volumes in a standard electric vehicle in IEA (2021).
-
19
See for example, World Bank, “New World Bank Survey Brings Hope to Malawi’s Mineral Potential,” 22 September 2015, www.worldbank.org/en/news/feature/2015/09/22/new-world-bank-survey-brings-hope-to-malawis-mineral-potential.
-
20
International Energy Agency, Global Supply Chains of EV Batteries (2022), www.iea.org/reports/global-supply-chains-of-ev-batteries.
-
21
African Minerals Development Centre (AMDC), “Unveiled: The #AMDC’s Theory of Change: A prosperous and transformed Africa achieved through sustainable development of mineral and energy resources...” Twitter post (11 October 2022), www.twitter.com/AfricanAmdc/status/1579789353584164864.
-
22
Based on S&P Global data and U.S. Geological Survey (2022). These sources sometimes differ significantly. An average is taken when the reported amounts are similar. When they are not, a third source is used to determine which is likely to be more accurate.
-
23
The correlation between exploration and mineral reserves per square kilometer is 0.79. The figure compares exploration for all metals except gold from 2002 to 2021 with current value of transition mineral reserves. Exploration spend, reserves and prices from S&P Global Market Intelligence; land area data from www.worldpopulationreview.com.
-
24
The correlation between the Resource Governance Index and Policy Potential Index scores is 0.5. The NRGI Resource Governance Index measures the transparency and accountability of mining institutions. The Policy Potential Index (PPI) in the Fraser Institute survey shows the attractiveness of a country’s policies to investors. The PPI score reported in the figure is an average of the scores from 2017 to 2021 where available, and average across jurisdictions for countries that have several. Some countries have low survey response rates, between 5 to 9 respondents. Natural Resource Governance Institute, “Resource Governance Index 2017,” 2017, resourcegovernanceindex.org; Yunis and Aliakbari (2021).
-
25
African Minerals Development Centre, Desktop Review of African Geological Survey Organisation Capacities and Gaps (United Nations Economic Commission for Africa, 2018), archive.uneca.org/publications/desktop-review-african-geological-survey-organisation-capacities-and-gaps.
-
26
Antony Sguazzin, “South Africa Sets 900 Million Annual Mineral Exploration Target,” Bloomberg, 12 April 2022, www.bloomberg.com/news/articles/2022-04-12/s-africa-sets-900-million-annual-mineral-exploration-target.
-
27
Oil exploration investment is known to correlated strongly with the quality of governance in a country, and it seems likely that a similar pattern holds for mineral exploration. See James Cust and Harding Torfinn, “Institutions and the Location of Oil Exploration”, Journal of the European Economic Association (2019).
-
28
Richard Schodde, “Key issues affecting the time delay between discovery and development – is it getting harder and longer?” PDAC 2014, 3 March 2014, Toronto. minexconsulting.com/wp-content/uploads/2019/04/Schodde-presentation-to-PDAC-March-2014.pdf
-
29
Summary of five studies. The outlier is the McKinsey study (7 to 10 years), but this was based on “large-scale greenfield assets” only. Like findings of Schodde (2021), which highlights that large projects are quicker. McKinsey (2022); IEA (2021); Tehmina Khan, Trang Nguyen, Franziska Ohnsorge, and Richard Schodde, “From Commodity Discovery to Production,” Policy Research Working Paper (World Bank, 2016); Paul Manalo, “Top mines average time from discovery to production: 16.9 years,” Metals and Mining Research S&P Global Market Intelligence (2020); Schodde (2014).
-
30
IEA (2021)
-
31
Schodde (2021) and Khan et al. (2016)
-
32
David Humphreys, “The mining industry and the supply of critical minerals,” Critical Minerals Handbook, Gus Gunn (ed.), chapter 2, 2013.
-
33
Khan et al. (2016)
-
34
Several of the experts interviewed for this report suggested that this is the main opportunity for shortening lead times.
-
35
David Manley, Patrick R.P. Heller and William Davis, No Time to Waste: Governing Cobalt Amid the Energy Transition (Natural Resource Governance Institute, 2022), resourcegovernance.org/no-time-to-waste-governing-cobalt-amid-energy-transition.
-
36
Matt Renaud and Mustafa Kumral, “Out of the Comfort Zone: Quantifying Country Risk for Foreign Mining Project Investment Feasibilities,” Mining, Metallurgy & Exploration, 38, 2323-2335 (2021), www.doi.org/10.1007/s42461-021-00495-8.
-
37
Based on S&P Global data and U.S. Geological Survey (2022). These sources sometimes differ significantly. An average is taken when the reported amounts are similar. When they are not, a third source is used to determine which is likely to be more accurate.
-
38
Henry Sanderson, “Vedanta starts arbitration against Zambia after mines seized,“ Financial Times, 31 May 2019. www.ft.com/content/98b0c464-83a1-11e9-b592-5fe435b57a3b.
-
39
Julia Tilley, “Labour talks 217: Escondida and other stories,” S&P Global Market Intelligence, Metals and Mining Research, 23 February 2017.
-
40
Keval Dhokia, “Global copper pipeline challenged due to disruption,” S&P Global Market Intelligence, Metals and Mining Research, 18 June 2019.
-
41
Sudarshan Varadhan, “Indian state seeks permanent closure of Vedanta’s copper smelter: officials,” Reuters, 24 May 2018. www.reuters.com/article/us-vedanta-smelter-idUSKCN1IP1CX.
-
42
Dhokia (2019)
-
43
Misha Savic, Jan Bratanic and Thomas Biesheuvel, “Europe’s Biggest Lithium Mine Blocked as Rio Loses in Serbia,” Bloomberg, 20 January 2022, www.bloomberg.com/news/articles/2022-01-20/serbia-suspends-rio-tinto-s-2-4-billion-lithium-mine-project.
-
44
Tanzania Minerals Audit Agency, A Study on Viability to Construct a Copper Concentrate Smelter in Tanzania (2011), www.scribd.com/document/193187016/A-Study-on-Viability-to-Construct-a-Copper-Concentrate-Smelter-in-Tanzania1.
-
45
Africa Confidential, “Local processing row holds up rare earth mine,” 25 October 2022, www.africa-confidential.com/article-preview/id/14166/Local_processing_row_holds_up_rare_earth_mine.
-
46
Reuters, “Timeline: The battle for Simandou,” 22 January 2021, www.reuters.com/article/us-swiss-steinmetz-timeline-idUSKBN29R2AA.
-
47
Magnus Ericsson and Olof Löf, “Mining’s contribution to national economies between 1996 and 2016,” Mineral Economics, 223–250 (2019), doi.org/10.1007/s13563-019-00191-6.
-
48
Net savings plus education expenditure and minus energy depletion, mineral depletion, net forest depletion, and carbon dioxide and particulate emissions damage. NRGI analysis of World Bank, “World Development Indicators,” accessed 28 September 2022, www.databank.worldbank.org/source/world-development-indicators.
-
49
Anthony J. Venables, “Using Natural Resources for Development: Why Has It Proven So Difficult?” Journal of Economic Perspectives, 30:1, 161–184 (2016) doi. org/10.1257/jep.30.1.161.
-
50
Giorgia Albertin, Boriana Yontcheva, Dan Devlin, Hilary Devine, Marc Gerard, Sebastian Beer, Irena Jankulov Suljagic and Vimal V. Thakoor, Tax Avoidance in Sub-Saharan Africa’s Mining Sector, Departmental Paper No 2021/022 (International Monetary Fund, 2021), www.imf.org/en/Publications/Departmental-Papers-Policy-Papers/Issues/2021/09/27/Tax-Avoidance-in-Sub-Saharan-Africas-Mining-Sector-464850
-
51
See for example, South African Human Rights Commission, National Hearing on the Underlying Socio-economic Challenges of Mining-affected Communities in South Africa (2016), www.sahrc.org.za/home/21/files/SAHRC%20Mining%20communities%20report%20FINAL.pdf
-
52
See, for example, Claude Kabemba, “How mineral resources can fuel the development of Africa in the context of post-Covid economic recovery,” Publish What You Pay Annual Conference, 14-15 March 2021, www.sarwatch.co.za/how-mineral-resources-can-fuel-the-development-of-africa-in-the-context-of-post-covid-economic-recovery.
-
53
See, for example, African Development Bank, Request for Expressions of Interest, 2022, www.afdb.org/sites/default/files/reoi_green_minerals_strategy_approach_paper_002.pdf.
-
54
Other partners currently include African Legal Support Facility, Africa Finance Corporation, Afreximbank, United Nations Economic Commission for Africa and United Nations Development Programme.
-
55
African Development Bank, “Why Africa is the next renewables powerhouse,” 7 December 2018, www.afdb.org/en/news-and-events/why-africa-is-the-next-renewables-powerhouse-18822
-
56
Manley et al (2022)
-
57
Through Power Africa (www.usaid.gov/powerafrica), for example.
-
58
Reserves data is from S&P Global Market Intelligence and U.S. Geological Survey. The above ground assets of a country comprise its power and transport infrastructure, human capital and other productive capabilities, level of environmental protection and investment climate. They have been converted to a regional index of 0-100.
The data is from multiple sources: African Development Bank, The Africa Infrastructure Development Index (AIDI) 2020, 2020, www.afdb.org/en/documents/economic-brief-africa-infrastructure-development-index-aidi-2020-july-2020; World Bank, “World Development Indicators”; African Development Bank, Electricity Regulatory Index (ERI) for Africa, 2021, 2021, africa-energy-portal.org/reports/electricity-regulatory-index-eri-africa-2021-edition; World Intellectual Property Organization, Global Innovation Index (GII) 2021, 2021, www.wipo.int/publications/en/details.jsp?id=4560; Harvard Growth Lab, “The Atlas of Economic Complexity,” accessed 20 September 2022, www.atlas.cid.harvard.edu/; Environmental Protection Index, “2022 Environmental Protection Index (2022),” accessed 20 September 2022, www.epi.yale.edu/; World Bank, “Doing Business 2020,” accessed 20 September 2022, www.worldbank.org/en/programs/business-enabling-environment/doing-business-legacy; S&P Global, “Control Risks Country Risk Summary,” accessed 20 September 2022, www.capitaliq.spglobal.com. -
59
Southern African Development Community and African Minerals Development Centre, Developing a Regional Mining Vision for the Southern African Development Community (SADC), 2018.
-
60
Manley et al (2022)
-
61
Emily Hersh, Alex Grant and Chris Berry, So, You Want to make Batteries Too? (Payne Institute, 2020), www.payneinstitute.mines.edu/so-you-want-to-make-batteries-better-too
-
62
Ibid.
-
63
See for example, African Development Bank, Lithium-Cobalt Value Chain Analysis for Mineral Based Industrialization in Africa (2021), www.afdb.org/en/documents/lithium-cobalt-value-chain-analysis-mineral-based-industrialization-Africa.
-
64
McKinsey & Company, Power to move: Accelerating the electric transport transition in sub-Saharan Africa (2022), www.mckinsey.com/industries/automotive-and-assembly/our-insights/power-to-move-accelerating-the-electric-transport-transition-in-sub- aharan-africa.
-
65
BloombergNEF, The Cost of Producing Battery Precursors in the DRC (2021), about. bnef.com/blog/producing-battery-materials-in-the-drc-could-lower-supply-chain-emissions-and-add-value-to-the-countrys-cobalt.
-
66
Mohua Mukherjee, India’s Mass-Market Clean Mobility Initiatives and its Unique, Customized Business Models for Light Electric Vehicles (The Oxford Institute for Energy Studies, 2022), www.oxfordenergy.org/publications/indias-mass-market-clean-mobility-initiatives-and-its-unique-customized-business-models-for-light-electric-vehicles.
-
67
Rwanda Ministry of Infrastructure, Strategic Paper on Electric Mobility Adaption in Rwanda (2021), www.mininfra.gov.rw/fileadmin/user_upload/Mininfra/Publications/Laws_Orders_and_Instructions/Transport/16062021_Strategic_Paper_for_e-mobility_adapta….
-
68
Manley et al (2022)
-
69
IEA (2022)
-
70
See for example World Gold Council, Responsible gold mining and value distribution, 2013 report (2013), www.gold.org/goldhub/research/responsible-gold-mining-and-value-distribution-2013-report.
-
71
World Gold Council (2013). Mining Shared Value has indicated these figures are representative of wider sector trends.
-
72
Jeff Geipel, Mining Shared Value, interview with authors, 25 September 2022.
-
73
Government of Canada, “Minerals Sector Employment,” January 2019, www.nrcan.gc.ca/science-data/science-research/earth-sciences/earth-sciences-resources/earth-sciences-federal-programs/minerals-sector-employment/16739; Mets Ignited, “METS in Australia,” accessed 28 September 2022, www.metsignited.org/australian-mets-sector/.
-
74
Aaron Cosbey and Isabelle Ramdoo, Guidance for Governments: Local Content Policies (Intergovernmental Forum on Mining, Minerals, Metals and Sustainable Development, 2018), igf-guidance-for-governments-local-content.pdf; International Finance Corporation, Guide to Getting Started in Local Procurement (2011), www.ifc.org/wps/wcm/connect/topics_ext_content/ifc_external_corporate_site/sustainability-at-ifc/publications/publications_handbook_guidetogettingsta…; Mining Shared Value and Engineers Without Borders, The Mining Local Procurement Reporting Mechanism (LPRM) (2017), www.miningsharedvalue.org/mininglprm.
-
75
See for example, activities of the Industrial Development Corporation (www.idc.co.za) and Anglo American’s Zimele programs (www.southafrica.angloamerican.com/our-difference/zimele)
-
76
Southern Africa Resource Watch, From Harmonisation of Policies to the Manufacturing of Lithium Batteries in Southern Africa: Collaboration between DRC and Zambia (2022), www.sarwatch.co.za/publication/from-harmonisation-of-policies-to-the-manufacturing-of-lithium-batteries-in-southern-africa-collaboration-between-drc-….
-
77
Jeff Geipel, Mining Shared Value, interview with authors, 25 September 2022.
-
78
Giorgia Albertin et al (2021). Note that the definition of mineral-dependent does not overlap with which countries have substantial reserves of transition minerals.
-
79
Ibid. The IMF estimates the 15 mineral-rich countries earned mining revenues equals 2 percent of GDP on average. This amounts to $13 billion a year.
-
80
For example, if companies were to adhere to more responsible tax practices such as the B Team Responsible Tax Principles. See The B Team, “Advancing Responsible Tax Practice,” accessed 28 September 2022, www.bteam.org/our-work/causes/governance/advancing-responsible-tax-practice.
-
81
Yannick Bouterige, Céline de Quatrebarbes and Bertrand Laporte, Mining Taxation in Africa: What Evolution in 2018? (International Centre for Tax and Development, 2020), www.ictd.ac/publication/mining-taxation-africa-recent-evolution.
-
82
Giorgia Albertin et al (2021).
-
83
For example, a study of contracts on resourcecontracts.org revealed that Burkina Faso, Burundi, Guinea, Madagascar and Mali had agreed stabilization clauses lasting 30- 34 years on average—significantly longer than necessary to ensure the bankability of projects. Intergovernmental Forum on Mining, Minerals, Metals and Sustainable Development, Insights on Incentives: Tax Competition in Mining (2019), www.iisd.org/sites/default/files/publications/insights-incentives-tax-competition-mining.pdf; Natural Resource Governance Institute, resourcecontracts.org.
-
84
NRGI analysis using S&P Global mineral reserves and price data. Prices are near-term forecasts and therefore may be elevated compared to the longer-term trend.
-
85
NRGI analysis. On average, 16 percent of mining sales revenue has gone to tax payments. See Robert Pitman and Kaisa Toroskainen, Beneath the surface: The Case for Oversight of Extractive Industry Suppliers (Natural Resource Governance Institute, 2020) resourcegovernance.org/analysis-tools/publications/beneath-surface-oversight-extractive-industry-suppliers.
This figure aligns with estimates in other studies: Olle Östensson, Local content, supply chains, and shared infrastructure, UNU-WIDER Working Paper (United Nations University, 2017), www.researchgate.net/publication/337699966_Local_content_supply_chains_and_shared_infrastructure; Price Waterhouse Coopers, Total Tax Contribution: A study of the economic contribution mining companies make to public finances (2010), www.pwc.co.uk/assets/pdf/ttc-mining-study-1.pdf. -
86
Anthony J. Venables (2016) and Natural Resource Governance Institute (2014).
-
87
NRGI (2017), “Resource Governance Index 2017.” There was a small improvement in a smaller sample of countries covered by the 2021 edition of the Resource Governance Institute.
-
88
Anna Fleming, Thomas Lassourd and David Manley, “Variable Royalties: an Answer to Volatile Mineral Prices?” in Handbook on the Future of Resource Taxation, African Tax Administration Forum and Intergovernmental Forum on Mining, Minerals, Metals and Sustainable Development (forthcoming),www.iisd.org/publications/brief/future-resource-taxation-roadmap.
-
89
Robert Pitman, “Contract Disclosure Policy and Practice Tracker,” accessed 15 October 2022, docs.google.com/spreadsheets/d/1FXEeD43jw6VYHV8yS-8KJ5-rR5l0XtKxVQZBWzr-ohY.
-
90
Based on membership of the Extractive Industries Transparency Initiative (www.eiti.org/countries).
-
91
Natural Resource Governance Institute, “Chile country profile,” accessed 5 October 2022, www.resourcegovernanceindex.org/country-profiles/CHL/mining.
-
92
Transparency International, “Corruption Perceptions Index 2021,” www.transparency.org/en/cpi/2021.
-
93
United Nations Office on Drugs and Crime, Corruption and Sustainable Development (no date), www.anticorruptionday.org/documents/actagainstcorruption/print/corr18_fs_DEVELOPMENT_en.pdf
-
94
K.C. Michaels, Louis Maréchal and Benjamin Katz, “Why is ESG so important to critical mineral supplies, and what can we do about it?” (International Energy Agency, 2022) www.iea.org/commentaries/why-is-esg-so-important-to-critical-mineral-supplies-and-what-can-we-do-about-it
-
95
Extractive Industries Transparency Initiative, Making the grade: Strengthening governance of critical minerals, www.eiti.org/documents/strengthening-governance-critical-minerals.
-
96
Extractive Industries Transparency Initiative, EITI Standard 2019, eiti.org/collections/ eiti-standard#EITI-Requirements-2019; Organisation for Economic Co-operation and Development, OECD Due Diligence Guidance for Responsible Supply Chains of Minerals from Conflict-Affected and High-Risk Areas (2016), www.oecd.org/daf/inv/mne/OECD-Due-Diligence-Guidance-Minerals-Edition3.pdf; Alexandra Gillies, Sebastian Sahla, Matthieu Salomon and Tom Shipley, Diagnosing Corruption in the Extractive Sector: A Tool for Research and Action (Natural Resource Governance Institute, 2021) www.resourcegovernance.org/analysis-tools/publications/diagnosing-corruption-extractive-sector-tool-research-and-actionrespectively.
-
97
Colombia National Mining Agency, Management and Corruption Risk Matrices of the ANM approved by the Institutional Management
and Performance Committee on 01/27/2022 (2022), www.anm.gov.co/?q=documentos_para_comentarios_ciudadania; Robert Pitman and Kaisa Toroskainen, “BHP, Others Increase Scrutiny of Subcontracting Corruption Risks” (Natural Resource Governance Institute, 2018) www.resourcegovernance.org/blog/bhp-others-increase-scrutiny-subcontracting-corruption-risks. -
98
Alexandra Gillies, “Will Extractive Companies Move Away from Corruption- Prone Intermediaries?”, (Natural Resource Governance Institute, 2019) www.resourcegovernance.org/blog/extractive-companies-corruption-intermediaries-middlemen-oil.
-
99
Natural Resource Governance Institute, Anticorruption Guidance for Partners of State-Owned Enterprises (2022), soe-anticorruption.resourcegovernance.org/chapters/avoiding-high-risk-agents
-
100
Favour Ime and Louise Russell-Prywata, “Beneficial ownership transparency and the fight against grand corruption in Nigeria” (Open Ownership, 2022), www.openownership.org/en/blog/beneficial-ownership-transparency-and-the-fight-against-grand-corruption-in-nigeria.
-
101
Nqobile Dludla, “South Africa mine dam wall collapses, Killing 1 and injuring 40,” Reuters, 11 September 2022, www.reuters.com/world/africa/south-africa-mine-dam-wall-collapses-killing-three-injuring-40-2022-09-11.
-
102
Kirsten Hund and Erik Reed, “A low-carbon future must protect the world’s forests” (World Bank, 2019), www.blogs.worldbank.org/voices/low-carbon-future-must-protect-worlds-forests.
-
103
NRGIcalculationsusingscope1,2and3 emissions (excluding fugitive methane and emissions from the combustion of coal) reported by Lindsay Delevingne, Will Glazener, Liesbet Grégoir and Kimberly Henderson, “Climate risk and decarbonisation: What every mining CEO needs to know,” McKinsey & Company, 2020 www.mckinsey.com/business-functions/sustainability/our-insights/climate-risk-and-decarbonization-what-every-mining-ceo-needs-to-know. Total global emissions are for 2019 from Climate Watch, “Global Historical Emissions,” accessed 18 September 2022, www.climatewatchdata.org/ghg-emissions?end_year=2019&start_year=1990.
-
104
See for example, Éléonore Lèbre, Martin Stringer, Kamila Svobodova, John R. Owen, Deanna Kemp, Claire Côte, Andrea Arratia-Solar and Rick K. Valenta, “The social and environmental complexities of extracting energy transition metals,” Nature Communications, 11: 4823 (2020), www.nature.com/articles/s41467-020-18661-9#MOESM1.
-
105
IEA (2021)
-
106
Ibid.
-
107
World Bank, “Climate Change Knowledge Portal,” accessed 28 September 2022, www.climateknowledgeportal.worldbank.org.
-
108
NRGI (2017)
-
109
Cameroon is one exception, with its new cadastre system preventing licenses being granted that overlap protected areas. Several companies also have a no-go policy, though only for World Heritage sites. See for example ICMM, “ICMM calls for stronger legal protection of World Heritage Sites,” 2016, www.icmm.com/en-gb/news/2016/icmm-calls-for-protection-of-world-heritage-sites.
-
110
Abbi Buxton, People and nature first: safeguards needed in mining exploration (International Institute for Environment and Development, 2021) www.iied.org/20736iied.
-
111
See for example in Colombia: Lorenzo Cotula, Investment disputes from below: whose rights matter? (International Institute for Environment and Development, 2020), www.iied.org/investment-disputes-below-whose-rights-matter.
-
112
Nicola Woodroffe and Tim Grice, Beyond Revenues: Measuring and Valuing Environmental and Social Impacts in Extractive Sector Governance (Natural Resource Governance Institute, 2019), www.resourcegovernance.org/analysis-tools/publications/beyond-revenues-measuring-environmental-social-impacts.
-
113
IFC, E&S Performance Standards (2012), www.ifc.org/wps/wcm/connect/topics_ext_content/ifc_external_corporate_site/sustainability-at-ifc/policies-standards/performance-standards; IGF, Environmental and Social Impact Assessments (2020), www.igfmining.org/our-work/environmental-and-social-impact-assessments.
-
114
Daniel Whyte, “Forest finance: how Gabon earned the first payment for conservation in Africa,” Climate Tracker, 8 December 2021, www.climatetracker.org/forest-protection-first-payment-gabon-africa.
-
115
See for example Taako Edema George, Kiemo Karatu, and Andama Edward, “An evaluation of the environmental impact assessment practice in Uganda: challenges and opportunities for achieving sustainable development,” Heliyon 6(9), 2020, www.ncbi.nlm.nih.gov/pmc/articles/PMC7505666.
-
116
See for example Organisation for Economic Co-operation and Development, Guiding Principles for Durable Extractive Contracts (2019), www.oecd.org/dev/Guiding_Principles_for_durable_ extractive_contracts.pdf; United Nations Human Rights Office
of the High Commissioner, Principles for Responsible Contracts: Integrating the Management of Human Rights Risks into State-Investor Contract Negotiations- Guidance for Negotiators (2015), www.ohchr.org/%20Documents/Publications/Principles_ResponsibleContracts_HR_PUB_15_1_EN.pdf; and NRGI (2014). -
117
See for example Reuters, “South Africa’s Gold Fields bets on solar to cut costs and carbon,” 13 October 2022, www.reuters.com/business/sustainable-business/south-africas-gold-fields-bets-solar-cut-costs-carbon-2022-10-13.
-
118
U.N. Climate Change Conference UK 2021, “Glasgow Leaders’ Declaration on Forests and Land Use,” 2021, ukcop26.org/glasgow-leaders-declaration-on-forests-and-land-use.
-
119
Frances Seymour, Tony La Vina and Kristen Hite, Evidence linking community-level tenure and forest condition: An annotated bibliography (Climate and Land Use Alliance, 2015), www.climateandlandusealliance.org/wp-content/uploads/2015/08/Community_level_tenure_and_forest_condition_bibliography.pdf.
-
120
Peter G. Veit, “9 Facts about Community Land and Climate Mitigation” (World Resources Institute, 2021) files.wri.org/d8/s3fs-public/2021-10/9-facts-about-community-land-and-climate-mitigation.pdf.
-
121
Development Bank of Southern Africa, African Environmental Assessment Legislation Handbook: Consultation Draft, 2021, www.dbsa.org/african-environmental-assessment-legislation-handbook.
-
122
United Nations Development Programme, Participatory Environmental Monitoring Committees in Mining Contexts, 2019, www.undp.org/publications/participatory-environmental-monitoring-committees-mining-contexts.
-
123
Jonathan Watts, “Murders of environment and land defenders hit record high,” The Guardian, 13 September 2021, www.theguardian.com/environment/2021/sep/13/murders-environment-land-defenders-record-high.
-
124
NRGI (2017), “Resource Governance Index 2017.” There was a small improvement in a smaller sample of countries covered by the 2021 edition of the Resource Governance Institute.
-
125
With a gold price of USD 1,600 per ounce.
-
126
With a low-profit mine and a gold price of $1,600 per ounce.
-
127
Cecilia Jamasmie, “Petra Diamonds’ stake in Williamson to shrink as part of deal with Tanzania,” Mining.com, 13 December 2021, www.mining.com/petra-diamonds-stake-in-williamson-to-shrink-as-part-of-deal-with-tanzania.
-
128
Lifezone Metals, “Kabanga Nickel Signs Framework Agreement,” 19 January 2021, www.lifezonemetals.com/kabanga-nickel-signs-framework-agreement.
-
129
Thomas Scurfield and Silas Olan’g, “Magufuli Seeks the Right Balance for Tanzania’s Mining Fiscal Regime,” NRGI, 31 January 2019, www.resourcegovernance.org/blog/magufuli-seeks-right-balance-tanzania-mining-fiscal; Thomas Scurfield, “Tanzania Strikes a Better Balance with its Mining Fiscal Regime,” NRGI, 24 June 2020, www.resourcegovernance.org/blog/tanzania-strikes-better-balance-mining-fiscal-regime.
-
130
This framework agreement was published in a document setting out Barrick’s offer to buy the shares it did not already own in Acacia Mining, the previous owner of the Bulyanhulu, Buzwagi and North Mara mines in Tanzania. See Acacia Mining and Barrick Gold, Recommended Final Offer for Acacia Mining Plc by Barrick Gold Corporation, 2019, 66–79, s25.q4cdn.com/322814910/files/doc_downloads/acacia/Acacia-2.7-announcement.pdf.
-
131
The main revenue streams are import duty, skills development levy, royalty, corporate income tax, a share of dividends and shareholder loan repayments through state equity, and dividend withholding tax.
-
132
The earlier in time a shilling (Tanzania’s official currency unit) is received, the more it is worth. This is, first, because it can be used earlier; and second, because the future is uncertain, and no one can be sure they will receive that shilling in the future. To account for this time value of money, a “discount rate” is applied. In the sharing arrangement, this would mean that if the government received a shilling in year 1, the company would need to receive more than a shilling in year 2 for the benefits to be comparable. However, given cumulation here is based on actual cash flow, the company would need to receive only a shilling in year 2 for the benefits to be shared equally.
-
133
This provision for the company to earn its minimum return before sharing is triggered means Ecuador’s mechanism is similar to an R-based cash flow tax, commonly referred to as a Brown Tax. See, e.g., Robin Broadway and Michael Keen, “Theoretical perspectives on resource tax design,” in The Taxation of Petroleum and Minerals: Principles, Problems and Practice, edited by Philip Daniel, Michael Keen and Charles McPherson (Oxford: Routledge, 2010), 13–74.
-
134
Prices are taken from World Bank, “Commodities Price Data (The Pink Sheet),” www.worldbank.org/en/research/commodity-markets.
-
135
With a gold price of $1,600 per ounce.
-
136
With a gold price of $1,600 per ounce.
-
137
With a gold price of $1,600 per ounce.
-
138
The Fraser Institute survey estimates that, unless there are extremely harmful policies, around 60 percent of an investment decision tends to be based on a country’s geology. The other 40 percent comprises of several other factors, including political stability and policy predictability (given they affect the risk that investors will not be able to secure future returns generated by their investments), a conducive business environment and the tax level. See Julio Mejia and Elmira Aliakbari, Fraser Institute Annual Survey of Mining Companies 2022, (Fraser Institute, 2023), 8, www.fraserinstitute.org/studies/annual-survey-of-mining-companies-2022.
-
139
However, information gaps make it difficult for taxes to be structured to capture all excess profit. See Jean-Franҫois Wen, Progressive Taxation of Extractive Resources as Second-Best Optimal Policy (International Monetary Fund, 2018), www.imf.org/en/Publications/WP/Issues/2018/06/13/Progressive-Taxation-of-Extractive-Resources-as-Second-Best-Optimal-Policy-45923.
-
140
Recent research provides a sense of the potential revenue loss to governments from tax avoidance. The International Monetary Fund recently estimated that sub-Saharan African mining countries could be losing between $450 and $730 million in corporate income tax a year. See Sebastian Beer and Dan Devlin, Is There Money on the Table? Evidence on the Magnitude of Profit Shifting in the Extractive Industries (International Monetary Fund, 2021), www.imf.org/en/Publications/WP/Issues/2021/01/15/Is-There-Money-on-the-Table-Evidence-on-the-Magnitude-of-Profit-Shifting-in-the-Extractive-49983.
-
141
It is perhaps surprising that Tanzania’s 50-50 sharing arrangement generates an AETR greater than 50 percent (with a discount rate of 10 percent). This is despite AETR measuring government take as the share of pre-tax profits, which is larger than “economic benefits” (given economic benefits exclude interest payments). This outcome results from the 50-50 split being based on actual cash flow. The government receives revenue before the mining company through input and production taxes that do not depend on the mine making a profit. Because of these earlier revenues, the government receives a larger share on a discounted basis.
-
142
As reported in the S&P Global database. Legal risks are “expropriation, state contract alteration and contract enforcement risks.” Tax risks are “tax increase and tax inconsistency risks.” Control Risks scores these risks as still “very high” and “high” respectively (following Tanzania’s overhaul of extractives sector laws and other actions against existing mines in 2017) but reducing.
-
143
With a discount rate of 10 percent. While Ecuador’s sharing mechanism does not account for the labor profit share because none of it will go to the government from 2024 onwards, I have included it in the AETR because it is a tax on the project. The Democratic Republic of Congo regime has an excess profits tax that is triggered for a mine when the realized price is at least 25 percent higher than the price in its feasibility study. I assumed that the feasibility study has a price of $1,300 per ounce, so the excess profits tax is not triggered.
-
144
Total benefits in this case are a project’s revenues minus operating costs and replacement capital (but not minus exploration and development capital). This cash flow represents the money available to pay back the initial investment and provide a return. The government share of it is a common measure of progressivity.
-
145
Wen, Progressive Taxation of Extractive Resources as Second-Best Optimal Policy.
-
146
With a discount rate of 10 percent. The results for only some countries are shown to clearly depict each data point. The results for all the evaluated countries can be found in my model.
-
147
Scurfield, “Tanzania Strikes a Better Balance with its Mining Fiscal Regime.”
-
148
This feature is not fully reflected in Figure 5 given that “total benefits” use a slightly different definition of profits and are based on discounted cash flows.
-
149
With a gold price of $1,600 per ounce.
-
150
For example, an average 62 percent of respondents to the Fraser Institute surveys between 2017 and 2019 said the current implementation of Tanzania’s legal system would strongly discourage investment, and 73 percent said regulatory uncertainty would. See, e.g., Ashley Stedman, Jairo Yunis and Elmira Aliakbari, Fraser Institute Annual Survey of Mining Companies 2019 (Fraser Institute, 2020), www.fraserinstitute.org/studies/annual-survey-of-mining-companies-2019.
-
151
With a low-profit mine and a gold price of $1,600 per ounce.
-
152
Tax avoidance could extend the Philippines’ recovery period, and therefore delay the payment of some taxes including import duty and interest withholding tax, given the end of the recovery period depends on the reported profitability of a mine rather than an ex-ante assessment. However, the rule that the recovery period must end five years from the start of production regardless of whether pre-production expenses have been recouped limits the extent to which it can be extended.
-
153
The merits of these measures require further scrutiny. E.g., taking a share of loan repayments could result in lenders charging a higher interest rate to ensure they still recoup their loan and a minimum return. This would not only reduce taxable income but also make it harder for the government to assess whether an interest rate is reasonable, because it would not be comparable with industry benchmarks. It can also be difficult for a government to always determine whether a loan is from a related party or not. However, these considerations are outside the scope of this analysis.
-
154
Natural Resource Governance Institute (NRGI), Natural Resource Charter, 2nd edition, 2014, resourcegovernance.org/analysis-tools/publications/natural-resource-charter-2nd-ed.
-
155
Although its exclusion of several significant taxes from the government’s share of benefits means low-profit mines may still be impacted.
-
156
With a gold price of $1,600 per ounce.
-
157
Anna Fleming, Thomas Lassourd and David Manley, “Variable Royalties: an Answer to Volatile Mineral Prices?” in Handbook on the Future of Resource Taxation, African Tax Administration Forum and Intergovernmental Forum on Mining, Minerals, Metals and Sustainable Development (forthcoming), www.iisd.org/publications/brief/future-resource-taxation-roadmap.
-
158
Ensuring that interest rates used as a comparison apply to comparable assets with a similar risk profile is challenging, but rules of this nature have been successful in reducing profit shifting in other countries. See Beer and Devlin, Is There Money on the Table?.
-
159
The main taxes listed are VAT, royalty and corporate income tax. The regime also includes a share of pre-tax profits that is currently divided between the company’s workers and the government, with the portion received by the government included in its accumulated benefits. However, a recent court ruling means that all this labor profit share will go to workers from the start of 2024 and therefore none of it will be included in government benefits.
-
160
The discount rate used is specific to each mine and based on its weighted average cost of capital (WACC). I have assumed that WACC is around 7 percent in real terms. This is based on the typical discount rate for equity shareholders used by industry and government analysts of 8 percent in real terms, and the current average cost of debt for the mining sector as reported by Aswath Damodaran, Damodaran Online, www.pages.stern.nyu.edu/~adamodar.
-
161
Republic of the Philippines, Financial or Technical Assistance Agreement, mgb.gov.ph/attachments/article/79/PFC_FTAA.pdf.
-
162
For example, some terms in the original FTAA for an OceanaGold mine differed in some areas: Republic of the Philippines, Financial or Technical Assistance Agreement with Arimco Mining Corporation, 1994, www.resourcecontracts.org/contract/ocds-591adf-2792396017. I understand that the recently signed extension to this agreement has slightly different terms again.
-
163
A template of the FARI model and a user guide that explains all the concepts and workings of the model are available at International Monetary Fund, “Fiscal Analysis of Resource Industries,”www.imf.org/external/np/fad/fari.
New Producer Contract Terms and Uncertainty: Lessons From the Recent Past

Key messages
- The discoveries of major deposits of oil and gas have historically generated significant hope for economic development in countries not previously known as petroleum- rich—sometimes called “new producers.” One source of optimism has been the theory that the discovery would reduce investors’ perception of geological risk and enable governments of producing countries to negotiate more favorable future contracts.
- A review of publicly available contracts across eight new producer countries shows that evidence in support of this theory in the recent past is mixed. Three of the eight secured more favorable terms in the contracts they signed after a discovery than in contracts they signed before the discovery. The other five countries studied demonstrated no such pattern.
- In some cases, governments did not take advantage of newfound post-discovery leverage. In others, such leverage did not materialize.
- The climate crisis and the global energy transition pose a further challenge to assumptions about government leverage in new producer countries, with the prospects of lower investor interest and lower value for production. Long-term global investment in the sector must decline dramatically to meet global climate goals, and many investors have begun to shift away from new projects. Governments in new producer countries should undertake sober analysis of market scenarios when deciding whether and how to pursue new projects, and should internally align their petroleum, finance, energy and climate objectives.
The petroleum industry is volatile, and governments in “new producer” countries have operated at a significant information disadvantage when negotiating with international oil companies. This challenge is growing today; new producer countries face intensifying questions around whether to offer fiscal incentives to maintain investment in the face of 1) the pandemic-induced volatility in oil prices and 2) long-term questions about the future of the industry in the face of the climate crisis and the global energy transition.
This confluence of short-term and long-term uncertainty is prompting a reexamination of the narrative that once took hold in many new producer countries. The traditional story was one of linear progression from being non-producers to small levels of production to ultimately having oil and gas become a major economic contributor over the long term.
This notion of progression was associated with a commonly held theory: After a country’s first major discovery, the geological risk that wells will be dry was expected to decrease. Countries could therefore shift from a position of having to grant tax breaks (and other concessions) to international investors, to taking a tougher stance in laws and negotiations for new projects going forward.
In this paper we examine whether this theory has been borne out in practice and make recommendations to support new producers in their navigation of the uncertainty associated with the energy transition.
Among the eight “new producer” countries, for which we analyzed a total of 26 contracts signed before and 25 contracts signed after discovery events (all occurring between 2001 and 2014), the evidence is mixed.
Notes
-
1
International Energy Agency, The Role of Critical Minerals in Clean Energy Transitions (2021), www.iea.org/reports/the-role-of-critical-minerals-in-clean-energy-transitions.
-
2
In this report we refer to both Africa north and south of the Sahara. When we mean one of the sub-regions we specify as such.
-
3
IEA (2021); Clyde Russell, “Mining is key to energy transition, but it’s still unloved,” Reuters, 11 May 2022, www.reuters.com/business/energy/mining-is-key-energy-transition-its-still-unloved-russell-2022-05-11; Jairo Yunis and Elmira Aliakbari, Annual Survey of Mining Companies 2020 (Fraser Institute, 2021), www.fraserinstitute. org/studies/annual-survey-of-mining-companies-2020.
-
4
See, for example, Natural Resource Governance Institute, Natural Resource Charter 2nd edition (2014), resourcegovernance.org/approach/natural-resource-charter.
-
5
Natural Resource Governance Institute, Resource Governance Index: From Legal Reform to Implementation in Sub-Saharan Africa (2018), resourcegovernance.org/sites/default/files/documents/rgi-from-legal-reform-to-implementation-sub-saharan-africa.pdf.
-
6
Africa Climate Foundation, Geopolitics of Critical Minerals in Renewable Energy Supply Chains (2022), africanclimatefoundation.org/news_and_analysis/geopolitics-of-critical-minerals-in-renewable-energy-supply-chains/.
-
7
See for example, Cooper Inveen, “Atlantic Lithium’s Ghana mine poised to being production by 2024,” Reuters, 20 September 2022, www.reuters.com/article/ghana-mining-lithium/atlantic-lithiums-ghana-mine-poised-to-begin-production-by-2024-idUSKBN2QV0NQ?utm_source=substack&utm_me….
-
8
As demonstrated by recent discussions between a U.S.-led group of rich countries and mineral producers such as the Democratic Republic of Congo, Namibia and Tanzania. Julian Pecquet, “US looks to Africa to
diversify supply chain for critical minerals,” The Africa Report, 23 September 2022. www.theafricareport.com/243847/us-looks-to-africa-to-diversify-supply-chain-for-critical-minerals. -
9
Glada Llahn and Paul Stevens, The curse of the one-size-fits-all fix, UNU-WIDER Working Paper (United Nations University, 2017), www.wider.unu.edu/sites/default/files/wp2017-21.pdf. For further assessment of donors’ activities in the past, both positive and negative lessons, see: Joanna Buckley, Neil McCulloch and Nick Travis, Donor-supported approaches to improving extractives governance, UNU-WIDER Working Paper (United Nations University, 2017), www.wider.unu.edu/sites/default/files/wp2017-33.pdf; Siân Herbert and Laura Bolton, Donor activity in the extractives sector (Knowledge, evidence and learning for development, 2018), opendocs.ids.ac.uk/opendocs/bitstream/handle/20.500.12413/13589/Donor_activity_in_the_extractives_sector.pdf.
-
10
Although this estimate includes emissions resulting from the investments by each group. Lucas Chancel, “Global carbon inequality over 1990–2019,” Nature Sustainability (2022), doi. org/10.1038/s41893-022-00955-z.
-
11
For Further reading on this dilemma and the arguments between the proponents of “green growth” and “degrowth, see: Alex Bowen and Samuel Fankhauser, “The Green Growth Narrative: Paradigm Shift or Just Spin? Global Environmental Change-human and Policy Dimensions,” Global Environmental Change, 21 (2021), 1157-1159, DOI: I:10.1016/j. gloenvcha.2011.07.007; Kate Raworth, Doughnut Economics: Seven Ways to Think Like a 21st Century Economist, Random House Business Books, London, 2017; Jason Hickel, “What does degrowth mean? A few points of clarification,” Globalizations, 18:7 (2021), 1105-1111, DOI: 10.1080/14747731.2020.1812222.
-
12
McKinsey & Company, “The raw-materials challenges: How the metals and mining sector will be at the core of enabling the energy transition” (2022), www.mckinsey. com/industries/metals-and-mining/our-insights/the-raw-materials-challenge-how-the-metals-and-mining-sector-will-be-at-the-core-of-enabling-the-energy-transition.
-
13
McKinsey & Company, “Metal mining constraints on the electric mobility horizon” (2018), www.mckinsey.com/industries/oil-and-gas/our-insights/metal-mining-constraints-on-the-electric-mobility-horizon.
-
14
McKinsey (2018)
-
15
NRGI analysis, based on Net Zero Tracker. “Net Zero Tracker,” Energy and Climate Intelligence Unit, Data-Driven EnviroLab, NewClimate Institute, Oxford Net Zero (2022), zerotracker.net
-
16
Pratima Desai, “Low carbon world needs $1.7 trillion in mining investment,” Reuters, 10 May 2021, www.reuters.com/business/energy/low-carbon-world-needs-17-trillion-mining-investment-2021-05-10/
-
17
Based on S&P Global Market Intelligence data and U.S. Geological Survey, Mineral Commodity Summaries 2022, 2022, www.pubs.er.usgs.gov/publication/mcs2022. These sources sometimes differ significantly. An average is taken when the reported amounts are similar. When they are not, a third source is used to determine which is likely to be more accurate.
-
18
NRGI analysis based on reserves reported in the S&P Globaldatabase and U.S. Geological Survey (2022), and the mineral volumes in a standard electric vehicle in IEA (2021).
-
19
See for example, World Bank, “New World Bank Survey Brings Hope to Malawi’s Mineral Potential,” 22 September 2015, www.worldbank.org/en/news/feature/2015/09/22/new-world-bank-survey-brings-hope-to-malawis-mineral-potential.
-
20
International Energy Agency, Global Supply Chains of EV Batteries (2022), www.iea.org/reports/global-supply-chains-of-ev-batteries.
-
21
African Minerals Development Centre (AMDC), “Unveiled: The #AMDC’s Theory of Change: A prosperous and transformed Africa achieved through sustainable development of mineral and energy resources...” Twitter post (11 October 2022), www.twitter.com/AfricanAmdc/status/1579789353584164864.
-
22
Based on S&P Global data and U.S. Geological Survey (2022). These sources sometimes differ significantly. An average is taken when the reported amounts are similar. When they are not, a third source is used to determine which is likely to be more accurate.
-
23
The correlation between exploration and mineral reserves per square kilometer is 0.79. The figure compares exploration for all metals except gold from 2002 to 2021 with current value of transition mineral reserves. Exploration spend, reserves and prices from S&P Global Market Intelligence; land area data from www.worldpopulationreview.com.
-
24
The correlation between the Resource Governance Index and Policy Potential Index scores is 0.5. The NRGI Resource Governance Index measures the transparency and accountability of mining institutions. The Policy Potential Index (PPI) in the Fraser Institute survey shows the attractiveness of a country’s policies to investors. The PPI score reported in the figure is an average of the scores from 2017 to 2021 where available, and average across jurisdictions for countries that have several. Some countries have low survey response rates, between 5 to 9 respondents. Natural Resource Governance Institute, “Resource Governance Index 2017,” 2017, resourcegovernanceindex.org; Yunis and Aliakbari (2021).
-
25
African Minerals Development Centre, Desktop Review of African Geological Survey Organisation Capacities and Gaps (United Nations Economic Commission for Africa, 2018), archive.uneca.org/publications/desktop-review-african-geological-survey-organisation-capacities-and-gaps.
-
26
Antony Sguazzin, “South Africa Sets 900 Million Annual Mineral Exploration Target,” Bloomberg, 12 April 2022, www.bloomberg.com/news/articles/2022-04-12/s-africa-sets-900-million-annual-mineral-exploration-target.
-
27
Oil exploration investment is known to correlated strongly with the quality of governance in a country, and it seems likely that a similar pattern holds for mineral exploration. See James Cust and Harding Torfinn, “Institutions and the Location of Oil Exploration”, Journal of the European Economic Association (2019).
-
28
Richard Schodde, “Key issues affecting the time delay between discovery and development – is it getting harder and longer?” PDAC 2014, 3 March 2014, Toronto. minexconsulting.com/wp-content/uploads/2019/04/Schodde-presentation-to-PDAC-March-2014.pdf
-
29
Summary of five studies. The outlier is the McKinsey study (7 to 10 years), but this was based on “large-scale greenfield assets” only. Like findings of Schodde (2021), which highlights that large projects are quicker. McKinsey (2022); IEA (2021); Tehmina Khan, Trang Nguyen, Franziska Ohnsorge, and Richard Schodde, “From Commodity Discovery to Production,” Policy Research Working Paper (World Bank, 2016); Paul Manalo, “Top mines average time from discovery to production: 16.9 years,” Metals and Mining Research S&P Global Market Intelligence (2020); Schodde (2014).
-
30
IEA (2021)
-
31
Schodde (2021) and Khan et al. (2016)
-
32
David Humphreys, “The mining industry and the supply of critical minerals,” Critical Minerals Handbook, Gus Gunn (ed.), chapter 2, 2013.
-
33
Khan et al. (2016)
-
34
Several of the experts interviewed for this report suggested that this is the main opportunity for shortening lead times.
-
35
David Manley, Patrick R.P. Heller and William Davis, No Time to Waste: Governing Cobalt Amid the Energy Transition (Natural Resource Governance Institute, 2022), resourcegovernance.org/no-time-to-waste-governing-cobalt-amid-energy-transition.
-
36
Matt Renaud and Mustafa Kumral, “Out of the Comfort Zone: Quantifying Country Risk for Foreign Mining Project Investment Feasibilities,” Mining, Metallurgy & Exploration, 38, 2323-2335 (2021), www.doi.org/10.1007/s42461-021-00495-8.
-
37
Based on S&P Global data and U.S. Geological Survey (2022). These sources sometimes differ significantly. An average is taken when the reported amounts are similar. When they are not, a third source is used to determine which is likely to be more accurate.
-
38
Henry Sanderson, “Vedanta starts arbitration against Zambia after mines seized,“ Financial Times, 31 May 2019. www.ft.com/content/98b0c464-83a1-11e9-b592-5fe435b57a3b.
-
39
Julia Tilley, “Labour talks 217: Escondida and other stories,” S&P Global Market Intelligence, Metals and Mining Research, 23 February 2017.
-
40
Keval Dhokia, “Global copper pipeline challenged due to disruption,” S&P Global Market Intelligence, Metals and Mining Research, 18 June 2019.
-
41
Sudarshan Varadhan, “Indian state seeks permanent closure of Vedanta’s copper smelter: officials,” Reuters, 24 May 2018. www.reuters.com/article/us-vedanta-smelter-idUSKCN1IP1CX.
-
42
Dhokia (2019)
-
43
Misha Savic, Jan Bratanic and Thomas Biesheuvel, “Europe’s Biggest Lithium Mine Blocked as Rio Loses in Serbia,” Bloomberg, 20 January 2022, www.bloomberg.com/news/articles/2022-01-20/serbia-suspends-rio-tinto-s-2-4-billion-lithium-mine-project.
-
44
Tanzania Minerals Audit Agency, A Study on Viability to Construct a Copper Concentrate Smelter in Tanzania (2011), www.scribd.com/document/193187016/A-Study-on-Viability-to-Construct-a-Copper-Concentrate-Smelter-in-Tanzania1.
-
45
Africa Confidential, “Local processing row holds up rare earth mine,” 25 October 2022, www.africa-confidential.com/article-preview/id/14166/Local_processing_row_holds_up_rare_earth_mine.
-
46
Reuters, “Timeline: The battle for Simandou,” 22 January 2021, www.reuters.com/article/us-swiss-steinmetz-timeline-idUSKBN29R2AA.
-
47
Magnus Ericsson and Olof Löf, “Mining’s contribution to national economies between 1996 and 2016,” Mineral Economics, 223–250 (2019), doi.org/10.1007/s13563-019-00191-6.
-
48
Net savings plus education expenditure and minus energy depletion, mineral depletion, net forest depletion, and carbon dioxide and particulate emissions damage. NRGI analysis of World Bank, “World Development Indicators,” accessed 28 September 2022, www.databank.worldbank.org/source/world-development-indicators.
-
49
Anthony J. Venables, “Using Natural Resources for Development: Why Has It Proven So Difficult?” Journal of Economic Perspectives, 30:1, 161–184 (2016) doi. org/10.1257/jep.30.1.161.
-
50
Giorgia Albertin, Boriana Yontcheva, Dan Devlin, Hilary Devine, Marc Gerard, Sebastian Beer, Irena Jankulov Suljagic and Vimal V. Thakoor, Tax Avoidance in Sub-Saharan Africa’s Mining Sector, Departmental Paper No 2021/022 (International Monetary Fund, 2021), www.imf.org/en/Publications/Departmental-Papers-Policy-Papers/Issues/2021/09/27/Tax-Avoidance-in-Sub-Saharan-Africas-Mining-Sector-464850
-
51
See for example, South African Human Rights Commission, National Hearing on the Underlying Socio-economic Challenges of Mining-affected Communities in South Africa (2016), www.sahrc.org.za/home/21/files/SAHRC%20Mining%20communities%20report%20FINAL.pdf
-
52
See, for example, Claude Kabemba, “How mineral resources can fuel the development of Africa in the context of post-Covid economic recovery,” Publish What You Pay Annual Conference, 14-15 March 2021, www.sarwatch.co.za/how-mineral-resources-can-fuel-the-development-of-africa-in-the-context-of-post-covid-economic-recovery.
-
53
See, for example, African Development Bank, Request for Expressions of Interest, 2022, www.afdb.org/sites/default/files/reoi_green_minerals_strategy_approach_paper_002.pdf.
-
54
Other partners currently include African Legal Support Facility, Africa Finance Corporation, Afreximbank, United Nations Economic Commission for Africa and United Nations Development Programme.
-
55
African Development Bank, “Why Africa is the next renewables powerhouse,” 7 December 2018, www.afdb.org/en/news-and-events/why-africa-is-the-next-renewables-powerhouse-18822
-
56
Manley et al (2022)
-
57
Through Power Africa (www.usaid.gov/powerafrica), for example.
-
58
Reserves data is from S&P Global Market Intelligence and U.S. Geological Survey. The above ground assets of a country comprise its power and transport infrastructure, human capital and other productive capabilities, level of environmental protection and investment climate. They have been converted to a regional index of 0-100.
The data is from multiple sources: African Development Bank, The Africa Infrastructure Development Index (AIDI) 2020, 2020, www.afdb.org/en/documents/economic-brief-africa-infrastructure-development-index-aidi-2020-july-2020; World Bank, “World Development Indicators”; African Development Bank, Electricity Regulatory Index (ERI) for Africa, 2021, 2021, africa-energy-portal.org/reports/electricity-regulatory-index-eri-africa-2021-edition; World Intellectual Property Organization, Global Innovation Index (GII) 2021, 2021, www.wipo.int/publications/en/details.jsp?id=4560; Harvard Growth Lab, “The Atlas of Economic Complexity,” accessed 20 September 2022, www.atlas.cid.harvard.edu/; Environmental Protection Index, “2022 Environmental Protection Index (2022),” accessed 20 September 2022, www.epi.yale.edu/; World Bank, “Doing Business 2020,” accessed 20 September 2022, www.worldbank.org/en/programs/business-enabling-environment/doing-business-legacy; S&P Global, “Control Risks Country Risk Summary,” accessed 20 September 2022, www.capitaliq.spglobal.com. -
59
Southern African Development Community and African Minerals Development Centre, Developing a Regional Mining Vision for the Southern African Development Community (SADC), 2018.
-
60
Manley et al (2022)
-
61
Emily Hersh, Alex Grant and Chris Berry, So, You Want to make Batteries Too? (Payne Institute, 2020), www.payneinstitute.mines.edu/so-you-want-to-make-batteries-better-too
-
62
Ibid.
-
63
See for example, African Development Bank, Lithium-Cobalt Value Chain Analysis for Mineral Based Industrialization in Africa (2021), www.afdb.org/en/documents/lithium-cobalt-value-chain-analysis-mineral-based-industrialization-Africa.
-
64
McKinsey & Company, Power to move: Accelerating the electric transport transition in sub-Saharan Africa (2022), www.mckinsey.com/industries/automotive-and-assembly/our-insights/power-to-move-accelerating-the-electric-transport-transition-in-sub- aharan-africa.
-
65
BloombergNEF, The Cost of Producing Battery Precursors in the DRC (2021), about. bnef.com/blog/producing-battery-materials-in-the-drc-could-lower-supply-chain-emissions-and-add-value-to-the-countrys-cobalt.
-
66
Mohua Mukherjee, India’s Mass-Market Clean Mobility Initiatives and its Unique, Customized Business Models for Light Electric Vehicles (The Oxford Institute for Energy Studies, 2022), www.oxfordenergy.org/publications/indias-mass-market-clean-mobility-initiatives-and-its-unique-customized-business-models-for-light-electric-vehicles.
-
67
Rwanda Ministry of Infrastructure, Strategic Paper on Electric Mobility Adaption in Rwanda (2021), www.mininfra.gov.rw/fileadmin/user_upload/Mininfra/Publications/Laws_Orders_and_Instructions/Transport/16062021_Strategic_Paper_for_e-mobility_adapta….
-
68
Manley et al (2022)
-
69
IEA (2022)
-
70
See for example World Gold Council, Responsible gold mining and value distribution, 2013 report (2013), www.gold.org/goldhub/research/responsible-gold-mining-and-value-distribution-2013-report.
-
71
World Gold Council (2013). Mining Shared Value has indicated these figures are representative of wider sector trends.
-
72
Jeff Geipel, Mining Shared Value, interview with authors, 25 September 2022.
-
73
Government of Canada, “Minerals Sector Employment,” January 2019, www.nrcan.gc.ca/science-data/science-research/earth-sciences/earth-sciences-resources/earth-sciences-federal-programs/minerals-sector-employment/16739; Mets Ignited, “METS in Australia,” accessed 28 September 2022, www.metsignited.org/australian-mets-sector/.
-
74
Aaron Cosbey and Isabelle Ramdoo, Guidance for Governments: Local Content Policies (Intergovernmental Forum on Mining, Minerals, Metals and Sustainable Development, 2018), igf-guidance-for-governments-local-content.pdf; International Finance Corporation, Guide to Getting Started in Local Procurement (2011), www.ifc.org/wps/wcm/connect/topics_ext_content/ifc_external_corporate_site/sustainability-at-ifc/publications/publications_handbook_guidetogettingsta…; Mining Shared Value and Engineers Without Borders, The Mining Local Procurement Reporting Mechanism (LPRM) (2017), www.miningsharedvalue.org/mininglprm.
-
75
See for example, activities of the Industrial Development Corporation (www.idc.co.za) and Anglo American’s Zimele programs (www.southafrica.angloamerican.com/our-difference/zimele)
-
76
Southern Africa Resource Watch, From Harmonisation of Policies to the Manufacturing of Lithium Batteries in Southern Africa: Collaboration between DRC and Zambia (2022), www.sarwatch.co.za/publication/from-harmonisation-of-policies-to-the-manufacturing-of-lithium-batteries-in-southern-africa-collaboration-between-drc-….
-
77
Jeff Geipel, Mining Shared Value, interview with authors, 25 September 2022.
-
78
Giorgia Albertin et al (2021). Note that the definition of mineral-dependent does not overlap with which countries have substantial reserves of transition minerals.
-
79
Ibid. The IMF estimates the 15 mineral-rich countries earned mining revenues equals 2 percent of GDP on average. This amounts to $13 billion a year.
-
80
For example, if companies were to adhere to more responsible tax practices such as the B Team Responsible Tax Principles. See The B Team, “Advancing Responsible Tax Practice,” accessed 28 September 2022, www.bteam.org/our-work/causes/governance/advancing-responsible-tax-practice.
-
81
Yannick Bouterige, Céline de Quatrebarbes and Bertrand Laporte, Mining Taxation in Africa: What Evolution in 2018? (International Centre for Tax and Development, 2020), www.ictd.ac/publication/mining-taxation-africa-recent-evolution.
-
82
Giorgia Albertin et al (2021).
-
83
For example, a study of contracts on resourcecontracts.org revealed that Burkina Faso, Burundi, Guinea, Madagascar and Mali had agreed stabilization clauses lasting 30- 34 years on average—significantly longer than necessary to ensure the bankability of projects. Intergovernmental Forum on Mining, Minerals, Metals and Sustainable Development, Insights on Incentives: Tax Competition in Mining (2019), www.iisd.org/sites/default/files/publications/insights-incentives-tax-competition-mining.pdf; Natural Resource Governance Institute, resourcecontracts.org.
-
84
NRGI analysis using S&P Global mineral reserves and price data. Prices are near-term forecasts and therefore may be elevated compared to the longer-term trend.
-
85
NRGI analysis. On average, 16 percent of mining sales revenue has gone to tax payments. See Robert Pitman and Kaisa Toroskainen, Beneath the surface: The Case for Oversight of Extractive Industry Suppliers (Natural Resource Governance Institute, 2020) resourcegovernance.org/analysis-tools/publications/beneath-surface-oversight-extractive-industry-suppliers.
This figure aligns with estimates in other studies: Olle Östensson, Local content, supply chains, and shared infrastructure, UNU-WIDER Working Paper (United Nations University, 2017), www.researchgate.net/publication/337699966_Local_content_supply_chains_and_shared_infrastructure; Price Waterhouse Coopers, Total Tax Contribution: A study of the economic contribution mining companies make to public finances (2010), www.pwc.co.uk/assets/pdf/ttc-mining-study-1.pdf. -
86
Anthony J. Venables (2016) and Natural Resource Governance Institute (2014).
-
87
NRGI (2017), “Resource Governance Index 2017.” There was a small improvement in a smaller sample of countries covered by the 2021 edition of the Resource Governance Institute.
-
88
Anna Fleming, Thomas Lassourd and David Manley, “Variable Royalties: an Answer to Volatile Mineral Prices?” in Handbook on the Future of Resource Taxation, African Tax Administration Forum and Intergovernmental Forum on Mining, Minerals, Metals and Sustainable Development (forthcoming),www.iisd.org/publications/brief/future-resource-taxation-roadmap.
-
89
Robert Pitman, “Contract Disclosure Policy and Practice Tracker,” accessed 15 October 2022, docs.google.com/spreadsheets/d/1FXEeD43jw6VYHV8yS-8KJ5-rR5l0XtKxVQZBWzr-ohY.
-
90
Based on membership of the Extractive Industries Transparency Initiative (www.eiti.org/countries).
-
91
Natural Resource Governance Institute, “Chile country profile,” accessed 5 October 2022, www.resourcegovernanceindex.org/country-profiles/CHL/mining.
-
92
Transparency International, “Corruption Perceptions Index 2021,” www.transparency.org/en/cpi/2021.
-
93
United Nations Office on Drugs and Crime, Corruption and Sustainable Development (no date), www.anticorruptionday.org/documents/actagainstcorruption/print/corr18_fs_DEVELOPMENT_en.pdf
-
94
K.C. Michaels, Louis Maréchal and Benjamin Katz, “Why is ESG so important to critical mineral supplies, and what can we do about it?” (International Energy Agency, 2022) www.iea.org/commentaries/why-is-esg-so-important-to-critical-mineral-supplies-and-what-can-we-do-about-it
-
95
Extractive Industries Transparency Initiative, Making the grade: Strengthening governance of critical minerals, www.eiti.org/documents/strengthening-governance-critical-minerals.
-
96
Extractive Industries Transparency Initiative, EITI Standard 2019, eiti.org/collections/ eiti-standard#EITI-Requirements-2019; Organisation for Economic Co-operation and Development, OECD Due Diligence Guidance for Responsible Supply Chains of Minerals from Conflict-Affected and High-Risk Areas (2016), www.oecd.org/daf/inv/mne/OECD-Due-Diligence-Guidance-Minerals-Edition3.pdf; Alexandra Gillies, Sebastian Sahla, Matthieu Salomon and Tom Shipley, Diagnosing Corruption in the Extractive Sector: A Tool for Research and Action (Natural Resource Governance Institute, 2021) www.resourcegovernance.org/analysis-tools/publications/diagnosing-corruption-extractive-sector-tool-research-and-actionrespectively.
-
97
Colombia National Mining Agency, Management and Corruption Risk Matrices of the ANM approved by the Institutional Management
and Performance Committee on 01/27/2022 (2022), www.anm.gov.co/?q=documentos_para_comentarios_ciudadania; Robert Pitman and Kaisa Toroskainen, “BHP, Others Increase Scrutiny of Subcontracting Corruption Risks” (Natural Resource Governance Institute, 2018) www.resourcegovernance.org/blog/bhp-others-increase-scrutiny-subcontracting-corruption-risks. -
98
Alexandra Gillies, “Will Extractive Companies Move Away from Corruption- Prone Intermediaries?”, (Natural Resource Governance Institute, 2019) www.resourcegovernance.org/blog/extractive-companies-corruption-intermediaries-middlemen-oil.
-
99
Natural Resource Governance Institute, Anticorruption Guidance for Partners of State-Owned Enterprises (2022), soe-anticorruption.resourcegovernance.org/chapters/avoiding-high-risk-agents
-
100
Favour Ime and Louise Russell-Prywata, “Beneficial ownership transparency and the fight against grand corruption in Nigeria” (Open Ownership, 2022), www.openownership.org/en/blog/beneficial-ownership-transparency-and-the-fight-against-grand-corruption-in-nigeria.
-
101
Nqobile Dludla, “South Africa mine dam wall collapses, Killing 1 and injuring 40,” Reuters, 11 September 2022, www.reuters.com/world/africa/south-africa-mine-dam-wall-collapses-killing-three-injuring-40-2022-09-11.
-
102
Kirsten Hund and Erik Reed, “A low-carbon future must protect the world’s forests” (World Bank, 2019), www.blogs.worldbank.org/voices/low-carbon-future-must-protect-worlds-forests.
-
103
NRGIcalculationsusingscope1,2and3 emissions (excluding fugitive methane and emissions from the combustion of coal) reported by Lindsay Delevingne, Will Glazener, Liesbet Grégoir and Kimberly Henderson, “Climate risk and decarbonisation: What every mining CEO needs to know,” McKinsey & Company, 2020 www.mckinsey.com/business-functions/sustainability/our-insights/climate-risk-and-decarbonization-what-every-mining-ceo-needs-to-know. Total global emissions are for 2019 from Climate Watch, “Global Historical Emissions,” accessed 18 September 2022, www.climatewatchdata.org/ghg-emissions?end_year=2019&start_year=1990.
-
104
See for example, Éléonore Lèbre, Martin Stringer, Kamila Svobodova, John R. Owen, Deanna Kemp, Claire Côte, Andrea Arratia-Solar and Rick K. Valenta, “The social and environmental complexities of extracting energy transition metals,” Nature Communications, 11: 4823 (2020), www.nature.com/articles/s41467-020-18661-9#MOESM1.
-
105
IEA (2021)
-
106
Ibid.
-
107
World Bank, “Climate Change Knowledge Portal,” accessed 28 September 2022, www.climateknowledgeportal.worldbank.org.
-
108
NRGI (2017)
-
109
Cameroon is one exception, with its new cadastre system preventing licenses being granted that overlap protected areas. Several companies also have a no-go policy, though only for World Heritage sites. See for example ICMM, “ICMM calls for stronger legal protection of World Heritage Sites,” 2016, www.icmm.com/en-gb/news/2016/icmm-calls-for-protection-of-world-heritage-sites.
-
110
Abbi Buxton, People and nature first: safeguards needed in mining exploration (International Institute for Environment and Development, 2021) www.iied.org/20736iied.
-
111
See for example in Colombia: Lorenzo Cotula, Investment disputes from below: whose rights matter? (International Institute for Environment and Development, 2020), www.iied.org/investment-disputes-below-whose-rights-matter.
-
112
Nicola Woodroffe and Tim Grice, Beyond Revenues: Measuring and Valuing Environmental and Social Impacts in Extractive Sector Governance (Natural Resource Governance Institute, 2019), www.resourcegovernance.org/analysis-tools/publications/beyond-revenues-measuring-environmental-social-impacts.
-
113
IFC, E&S Performance Standards (2012), www.ifc.org/wps/wcm/connect/topics_ext_content/ifc_external_corporate_site/sustainability-at-ifc/policies-standards/performance-standards; IGF, Environmental and Social Impact Assessments (2020), www.igfmining.org/our-work/environmental-and-social-impact-assessments.
-
114
Daniel Whyte, “Forest finance: how Gabon earned the first payment for conservation in Africa,” Climate Tracker, 8 December 2021, www.climatetracker.org/forest-protection-first-payment-gabon-africa.
-
115
See for example Taako Edema George, Kiemo Karatu, and Andama Edward, “An evaluation of the environmental impact assessment practice in Uganda: challenges and opportunities for achieving sustainable development,” Heliyon 6(9), 2020, www.ncbi.nlm.nih.gov/pmc/articles/PMC7505666.
-
116
See for example Organisation for Economic Co-operation and Development, Guiding Principles for Durable Extractive Contracts (2019), www.oecd.org/dev/Guiding_Principles_for_durable_ extractive_contracts.pdf; United Nations Human Rights Office
of the High Commissioner, Principles for Responsible Contracts: Integrating the Management of Human Rights Risks into State-Investor Contract Negotiations- Guidance for Negotiators (2015), www.ohchr.org/%20Documents/Publications/Principles_ResponsibleContracts_HR_PUB_15_1_EN.pdf; and NRGI (2014). -
117
See for example Reuters, “South Africa’s Gold Fields bets on solar to cut costs and carbon,” 13 October 2022, www.reuters.com/business/sustainable-business/south-africas-gold-fields-bets-solar-cut-costs-carbon-2022-10-13.
-
118
U.N. Climate Change Conference UK 2021, “Glasgow Leaders’ Declaration on Forests and Land Use,” 2021, ukcop26.org/glasgow-leaders-declaration-on-forests-and-land-use.
-
119
Frances Seymour, Tony La Vina and Kristen Hite, Evidence linking community-level tenure and forest condition: An annotated bibliography (Climate and Land Use Alliance, 2015), www.climateandlandusealliance.org/wp-content/uploads/2015/08/Community_level_tenure_and_forest_condition_bibliography.pdf.
-
120
Peter G. Veit, “9 Facts about Community Land and Climate Mitigation” (World Resources Institute, 2021) files.wri.org/d8/s3fs-public/2021-10/9-facts-about-community-land-and-climate-mitigation.pdf.
-
121
Development Bank of Southern Africa, African Environmental Assessment Legislation Handbook: Consultation Draft, 2021, www.dbsa.org/african-environmental-assessment-legislation-handbook.
-
122
United Nations Development Programme, Participatory Environmental Monitoring Committees in Mining Contexts, 2019, www.undp.org/publications/participatory-environmental-monitoring-committees-mining-contexts.
-
123
Jonathan Watts, “Murders of environment and land defenders hit record high,” The Guardian, 13 September 2021, www.theguardian.com/environment/2021/sep/13/murders-environment-land-defenders-record-high.
-
124
NRGI (2017), “Resource Governance Index 2017.” There was a small improvement in a smaller sample of countries covered by the 2021 edition of the Resource Governance Institute.
-
125
With a gold price of USD 1,600 per ounce.
-
126
With a low-profit mine and a gold price of $1,600 per ounce.
-
127
Cecilia Jamasmie, “Petra Diamonds’ stake in Williamson to shrink as part of deal with Tanzania,” Mining.com, 13 December 2021, www.mining.com/petra-diamonds-stake-in-williamson-to-shrink-as-part-of-deal-with-tanzania.
-
128
Lifezone Metals, “Kabanga Nickel Signs Framework Agreement,” 19 January 2021, www.lifezonemetals.com/kabanga-nickel-signs-framework-agreement.
-
129
Thomas Scurfield and Silas Olan’g, “Magufuli Seeks the Right Balance for Tanzania’s Mining Fiscal Regime,” NRGI, 31 January 2019, www.resourcegovernance.org/blog/magufuli-seeks-right-balance-tanzania-mining-fiscal; Thomas Scurfield, “Tanzania Strikes a Better Balance with its Mining Fiscal Regime,” NRGI, 24 June 2020, www.resourcegovernance.org/blog/tanzania-strikes-better-balance-mining-fiscal-regime.
-
130
This framework agreement was published in a document setting out Barrick’s offer to buy the shares it did not already own in Acacia Mining, the previous owner of the Bulyanhulu, Buzwagi and North Mara mines in Tanzania. See Acacia Mining and Barrick Gold, Recommended Final Offer for Acacia Mining Plc by Barrick Gold Corporation, 2019, 66–79, s25.q4cdn.com/322814910/files/doc_downloads/acacia/Acacia-2.7-announcement.pdf.
-
131
The main revenue streams are import duty, skills development levy, royalty, corporate income tax, a share of dividends and shareholder loan repayments through state equity, and dividend withholding tax.
-
132
The earlier in time a shilling (Tanzania’s official currency unit) is received, the more it is worth. This is, first, because it can be used earlier; and second, because the future is uncertain, and no one can be sure they will receive that shilling in the future. To account for this time value of money, a “discount rate” is applied. In the sharing arrangement, this would mean that if the government received a shilling in year 1, the company would need to receive more than a shilling in year 2 for the benefits to be comparable. However, given cumulation here is based on actual cash flow, the company would need to receive only a shilling in year 2 for the benefits to be shared equally.
-
133
This provision for the company to earn its minimum return before sharing is triggered means Ecuador’s mechanism is similar to an R-based cash flow tax, commonly referred to as a Brown Tax. See, e.g., Robin Broadway and Michael Keen, “Theoretical perspectives on resource tax design,” in The Taxation of Petroleum and Minerals: Principles, Problems and Practice, edited by Philip Daniel, Michael Keen and Charles McPherson (Oxford: Routledge, 2010), 13–74.
-
134
Prices are taken from World Bank, “Commodities Price Data (The Pink Sheet),” www.worldbank.org/en/research/commodity-markets.
-
135
With a gold price of $1,600 per ounce.
-
136
With a gold price of $1,600 per ounce.
-
137
With a gold price of $1,600 per ounce.
-
138
The Fraser Institute survey estimates that, unless there are extremely harmful policies, around 60 percent of an investment decision tends to be based on a country’s geology. The other 40 percent comprises of several other factors, including political stability and policy predictability (given they affect the risk that investors will not be able to secure future returns generated by their investments), a conducive business environment and the tax level. See Julio Mejia and Elmira Aliakbari, Fraser Institute Annual Survey of Mining Companies 2022, (Fraser Institute, 2023), 8, www.fraserinstitute.org/studies/annual-survey-of-mining-companies-2022.
-
139
However, information gaps make it difficult for taxes to be structured to capture all excess profit. See Jean-Franҫois Wen, Progressive Taxation of Extractive Resources as Second-Best Optimal Policy (International Monetary Fund, 2018), www.imf.org/en/Publications/WP/Issues/2018/06/13/Progressive-Taxation-of-Extractive-Resources-as-Second-Best-Optimal-Policy-45923.
-
140
Recent research provides a sense of the potential revenue loss to governments from tax avoidance. The International Monetary Fund recently estimated that sub-Saharan African mining countries could be losing between $450 and $730 million in corporate income tax a year. See Sebastian Beer and Dan Devlin, Is There Money on the Table? Evidence on the Magnitude of Profit Shifting in the Extractive Industries (International Monetary Fund, 2021), www.imf.org/en/Publications/WP/Issues/2021/01/15/Is-There-Money-on-the-Table-Evidence-on-the-Magnitude-of-Profit-Shifting-in-the-Extractive-49983.
-
141
It is perhaps surprising that Tanzania’s 50-50 sharing arrangement generates an AETR greater than 50 percent (with a discount rate of 10 percent). This is despite AETR measuring government take as the share of pre-tax profits, which is larger than “economic benefits” (given economic benefits exclude interest payments). This outcome results from the 50-50 split being based on actual cash flow. The government receives revenue before the mining company through input and production taxes that do not depend on the mine making a profit. Because of these earlier revenues, the government receives a larger share on a discounted basis.
-
142
As reported in the S&P Global database. Legal risks are “expropriation, state contract alteration and contract enforcement risks.” Tax risks are “tax increase and tax inconsistency risks.” Control Risks scores these risks as still “very high” and “high” respectively (following Tanzania’s overhaul of extractives sector laws and other actions against existing mines in 2017) but reducing.
-
143
With a discount rate of 10 percent. While Ecuador’s sharing mechanism does not account for the labor profit share because none of it will go to the government from 2024 onwards, I have included it in the AETR because it is a tax on the project. The Democratic Republic of Congo regime has an excess profits tax that is triggered for a mine when the realized price is at least 25 percent higher than the price in its feasibility study. I assumed that the feasibility study has a price of $1,300 per ounce, so the excess profits tax is not triggered.
-
144
Total benefits in this case are a project’s revenues minus operating costs and replacement capital (but not minus exploration and development capital). This cash flow represents the money available to pay back the initial investment and provide a return. The government share of it is a common measure of progressivity.
-
145
Wen, Progressive Taxation of Extractive Resources as Second-Best Optimal Policy.
-
146
With a discount rate of 10 percent. The results for only some countries are shown to clearly depict each data point. The results for all the evaluated countries can be found in my model.
-
147
Scurfield, “Tanzania Strikes a Better Balance with its Mining Fiscal Regime.”
-
148
This feature is not fully reflected in Figure 5 given that “total benefits” use a slightly different definition of profits and are based on discounted cash flows.
-
149
With a gold price of $1,600 per ounce.
-
150
For example, an average 62 percent of respondents to the Fraser Institute surveys between 2017 and 2019 said the current implementation of Tanzania’s legal system would strongly discourage investment, and 73 percent said regulatory uncertainty would. See, e.g., Ashley Stedman, Jairo Yunis and Elmira Aliakbari, Fraser Institute Annual Survey of Mining Companies 2019 (Fraser Institute, 2020), www.fraserinstitute.org/studies/annual-survey-of-mining-companies-2019.
-
151
With a low-profit mine and a gold price of $1,600 per ounce.
-
152
Tax avoidance could extend the Philippines’ recovery period, and therefore delay the payment of some taxes including import duty and interest withholding tax, given the end of the recovery period depends on the reported profitability of a mine rather than an ex-ante assessment. However, the rule that the recovery period must end five years from the start of production regardless of whether pre-production expenses have been recouped limits the extent to which it can be extended.
-
153
The merits of these measures require further scrutiny. E.g., taking a share of loan repayments could result in lenders charging a higher interest rate to ensure they still recoup their loan and a minimum return. This would not only reduce taxable income but also make it harder for the government to assess whether an interest rate is reasonable, because it would not be comparable with industry benchmarks. It can also be difficult for a government to always determine whether a loan is from a related party or not. However, these considerations are outside the scope of this analysis.
-
154
Natural Resource Governance Institute (NRGI), Natural Resource Charter, 2nd edition, 2014, resourcegovernance.org/analysis-tools/publications/natural-resource-charter-2nd-ed.
-
155
Although its exclusion of several significant taxes from the government’s share of benefits means low-profit mines may still be impacted.
-
156
With a gold price of $1,600 per ounce.
-
157
Anna Fleming, Thomas Lassourd and David Manley, “Variable Royalties: an Answer to Volatile Mineral Prices?” in Handbook on the Future of Resource Taxation, African Tax Administration Forum and Intergovernmental Forum on Mining, Minerals, Metals and Sustainable Development (forthcoming), www.iisd.org/publications/brief/future-resource-taxation-roadmap.
-
158
Ensuring that interest rates used as a comparison apply to comparable assets with a similar risk profile is challenging, but rules of this nature have been successful in reducing profit shifting in other countries. See Beer and Devlin, Is There Money on the Table?.
-
159
The main taxes listed are VAT, royalty and corporate income tax. The regime also includes a share of pre-tax profits that is currently divided between the company’s workers and the government, with the portion received by the government included in its accumulated benefits. However, a recent court ruling means that all this labor profit share will go to workers from the start of 2024 and therefore none of it will be included in government benefits.
-
160
The discount rate used is specific to each mine and based on its weighted average cost of capital (WACC). I have assumed that WACC is around 7 percent in real terms. This is based on the typical discount rate for equity shareholders used by industry and government analysts of 8 percent in real terms, and the current average cost of debt for the mining sector as reported by Aswath Damodaran, Damodaran Online, www.pages.stern.nyu.edu/~adamodar.
-
161
Republic of the Philippines, Financial or Technical Assistance Agreement, mgb.gov.ph/attachments/article/79/PFC_FTAA.pdf.
-
162
For example, some terms in the original FTAA for an OceanaGold mine differed in some areas: Republic of the Philippines, Financial or Technical Assistance Agreement with Arimco Mining Corporation, 1994, www.resourcecontracts.org/contract/ocds-591adf-2792396017. I understand that the recently signed extension to this agreement has slightly different terms again.
-
163
A template of the FARI model and a user guide that explains all the concepts and workings of the model are available at International Monetary Fund, “Fiscal Analysis of Resource Industries,”www.imf.org/external/np/fad/fari.
Selling Oil Assets in Uganda and Ghana: A Taxing Problem
When companies sell their oil and gas assets before production has even begun, they may turn a profit long before the host country can collect the tax revenues typically associated with production. The prospect of an immediate upside for industry with uncertain or delayed benefits for countries has sparked a debate over capital gains taxes on pre-production sales. Analyst and RWI advisor Keith Myers reviews current controversies in Uganda and Ghana, using these emerging oil nations to make the case for clearer extractive sector taxation rules.
Read Keith Myers'1 analysis below or download the brief here ... (pdf)
The transfer of pre-production oil and gas assets in Ghana and Uganda has triggered disputes over the fairness and taxation of capital gains. This note aims to clarify some of the issues involved and make the case for clearer rules in future petroleum agreements concerning asset transfers and capital gains taxation.
The sale of Heritage Oil's assets in Uganda and Kosmos Energy's planned sale in Ghana has sparked contention over whether, and how much, capital gains tax is due when pre-production assets are sold. Both deals deliver very high returns on investment for the companies involved, but not returns that are without precedent for companies discovering new billion-barrel petroleum provinces in frontier areas.
However, the deals are hard to explain politically because the returns to investors have been delivered before production has started and significant government tax revenues paid.
Unfortunately, there is no standard practice in oil producing countries for the treatment of capital gains and no consensus on best practice. It should be no surprise then that these deals give rise to disputes, symptomatic of immature petroleum governance systems in both countries. (Uganda has changed its tax rules three times in the last two years.)
While the moral case that Uganda and Ghana should benefit financially from the sale of their oil assets is clear, the legal arguments on either side are less so. The rules concerning the transfer of petroleum assets and capital gains taxation in both Uganda and Ghana should be clarified and included in the good governance agenda.
This note examines the situations in Uganda and Ghana and places them within the context of the three most common approaches to taxing capital gains on oil properties used by oil producing countries.
Introduction
The taxation of gains on disposal of petroleum licences is central to conflicts holding up the transfer of assets in Uganda from Heritage to Tullow Oil, CNOOC and Total. Tullow has exercised pre-emption rights to acquire Heritage's interests for $1.45 billion.2 Tullow in turn proposes to sell part of its interests to CNOOC and Total. The Ugandan government claims a tax of more than $400 million (which Heritage disputes) on the Heritage disposals, and aims to claim further tax on Tullow's disposals. In Ghana it has been reported that Kosmos had negotiated to sell its interest in the Jubilee Field to ExxonMobil for more than $4 billion. This sale was abandoned in the face of objections from several parties, including the Ghana National Petroleum Company, which wants to buy the interest itself. Again, the tax treatment of any disposal may be an issue.
The sums involved are significant and the issue is highly political - $400 million is more than the Ugandan government's annual health budget. Ugandan Energy minister Hilary Onek was quoted by the Financial Times3 as saying, "The oil fields are not in London. They [Heritage] are doing business here based on a national asset. They are obliged to pay the tax." He continued, "If I were Heritage I would not go for arbitration. I would just pay my tax and get my super profit."
This brief first compares the Heritage and Kosmos transactions to assess the extent to which they could be described as abnormal or "super profits" in the context of the industry. It then describes three models for taxing capital gains used by producing countries and examines the key policy issues that arise. Lastly, it considers the tax issues arising on disposals of petroleum licences in Uganda and Ghana, using these cases to illustrate some of the policy issues highlighted in the earlier discussion.
Are the Heritage and Kosmos transactions exceptional?
Table 1 Selected oil and gas transactions for oil and gas companies.4
| Company | Country | Year | Years of operation | Equity Capital Invested | Exit Equity Value | "Profit" $m |
Recycle Ratio5 |
| Burren Energy | Congo/Turk'stan | 2007 | 6 | 139 | 3500 | 3361 | 25.2 |
| Emerald | Syria/Columbia | 2009 | 11 | 72.5 | 867 | 794.5 | 12.0 |
| Heritage | Uganda | 2009 | 11 | 150 | 1450 | 1300 | 9.0 |
| Addax | W Africa/Kurd | 2009 | 15 | 848 | 7222 | 6374 | 8.5 |
| Kosmos6 | Ghana | 2009 | 5 | 500 | 4000 | 3500 | 8.0 |
| Tanganyika | Syria | 2008 | 9 | 331 | 1930 | 1599 | 5.8 |
| Arrow | Australia | 2010 | 7 | 615 | 3100 | 2485 | 5.0 |
| Venture | UK | 2009 | 10 | 477 | 2081 | 1604 | 4.4 |
| Rift Oil | PNG | 2009 | 5 | 45 | 184 | 139 | 4.1 |
| XTO | USA | 2009 | 23 | 8500 | 31000 | 22500 | 3.6 |
| Revus | Norway | 2008 | 5 | 201 | 720 | 519 | 3.6 |
| Indago | Oman | 2007 | 2 | 112 | 374 | 262 | 3.3 |
| Intrepid | UK | 2004 | 7 | 300 | 1000 | 700 | 3.3 |
| Plectrum | Tunisia | 2007 | 2 | 17.5 | 46.8 | 29.3 | 2.7 |
| Medoil | Tunisia | 2007 | 2 | 10 | 25 | 14.68 | 2.5 |
| Hardman | Global | 2006 | 10 | 455 | 1100 | 645 | 2.4 |
| Imperial | Russia | 2008 | 4 | 1039 | 2100 | 1061 | 2.0 |
| Verenex | Libya | 2009 | 4 | 177 | 344 | 167 | 1.9 |
| Wham | UK | 2007 | 2 | 20 | 28 | 8.4 | 1.4 |
| Granby | UK | 2008 | 6 | 33.8 | 45 | 11.2 | 1.3 |
| First Calgary | Algeria | 2008 | 11 | 831 | 865 | 34 | 1.0 |
| Genesis | Norway/UK | 2009 | 4 | 46 | 24 | -21.7 | 0.5 |
| Bow Valley | UK | 2009 | 9 | 190 | 35 | -155 | 0.2 |
| Oilexco | UK | 2009 | 9 | 539 | 27 | -512 | 0.1 |
Table 1 shows selected corporate transactions between 2004 and 2009. Measured in terms of dollars returned for every dollar invested, the Heritage and Kosmos transactions rank in the top five with returns of $9 and $8 respectively for every $1 invested. While high, the returns have industrial precedents. It should also be remembered that when Heritage first signed its exploration agreements with Uganda in 1997 the oil price was around $19/bbl and the area was a complete frontier - considered to be very high risk and of little interest to larger companies.
A good analogy would be Cairn Energy's market valuation following its exploration success in the period 2002-2004 in Rajasthan, India. Cairn bought out Shell's interest in the frontier basin in 2002 and proceeded to make a series of discoveries reporting two billion barrels of oil in place by the end of 2004 pre-development. Cairn spent just over $300 million on exploration and the market capitalization increased by $2.7 billion: an increase of approximately $9 for every $1 invested in exploration and very similar to the returns realized by Heritage and Kosmos. Unlike Heritage and Kosmos, Cairn Energy decided to stay and develop the oil they had discovered, spending $2.5 billion through their 62%-owned listed subsidiary Cairn India. Cairn recently announced a sale of up to 80% of its equity in Cairn India to Vedanta Resources for $8.5 billion.7
The returns may seem extraordinary in retrospect, but it is rare for a small company to be instrumental in the discovery of a new billion barrel petroleum province. This is what Cairn, Kosmos and Heritage have done.
From the host country's perspective, a high sales price could be seen as a positive thing as it suggests the buyer is anticipating very significant levels of production that should lead to future taxes and royalties for years to come. Selling companies would argue that large capital gains simply indicate that they have created significant future value for the government through their activities.
The complications in Uganda and Ghana are that the transactions (or planned transaction, in the case of Ghana) were made before production (or even development, in Heritage's case) had commenced. Thus, the companies are realizing very large profits before the government has begun to receive taxes or royalties from the assets. This fact has highlighted the issue of capital gains taxation in the extractive sector in a way that a mid-stream sale of producing assets perhaps could not: it is hard for politicians to explain how large profits have been made on national assets without any taxes yet being paid.
While the timing of these particular transactions has created a particularly acute political issue, from a policy perspective the questions they raise about how to best tax capital gains are relevant in virtually all mineral rich countries. How do most countries tax capital gains?
Approaches to Capital Gains Tax
Gains on licence disposals are not normally relevant for the purposes of calculating royalty, production sharing or resource rent taxes. The issue is how they are dealt with for the purposes of corporate income tax (CIT). Broadly speaking, there are three possible approaches to taxing capital gains on the disposal of oil and gas assets:
- Ignore gains on licence disposals in taxing both seller and buyer;
- Tax gains on the seller and allow a corresponding deduction to the buyer; or
- Tax gains on the seller but restrict deductions for the buyer.
Approach 1 - Ignore Capital Gains
One approach is for gains to be disregarded in taxing both seller and purchaser. This leaves companies free to negotiate deals on a purely commercial basis, without having to adjust transaction prices to account for any capital gains tax. To take a simplified example, if company A is a willing seller and company B a willing buyer and each agrees that the value of a licence interest is $1 billion, they can do the deal at that price without tax complications. This treatment is clearly favoured by companies as it minimises transaction costs, but it also has advantages for the government as it makes it easier to transfer licences to those companies with the capital and expertise needed and best placed to develop the country's resources effectively. Moreover, it is administratively simple.
From a purely economic policy perspective, this approach also holds some attraction. As long as the government is satisfied that a reasonable share of oil revenues will be paid to it over the lifetime of licence operations, it theoretically need not concern itself with licence transfers and their impact on how benefits are shared among successive licence holders. This approach is followed by Norway and several other countries have adopted it in recent years.
While this approach may be the most convenient for the taxpayer and hold some theoretical economic advantages for countries, it is nevertheless somewhat unconventional from a tax theory viewpoint. After all, gains on the sale of licence interests are often huge, and if the purpose of CIT is to tax a company's income, how can it be right just to ignore them? Moreover, there are strong practical reasons why governments might wish to tax gains on a sale. It is clearly difficult for the government of a developing country to be seen to allow oil companies to walk away without paying tax on a billion dollar gain. The gain may arise early in the development of the country's oil resources; the public may have inflated expectations of oil benefits, and be impatient for them to be realised; or the public may mistrust the government's intentions. Theoretical arguments about long-term tax neutrality or the administrative convenience of ignoring these gains for tax are likely to be outweighed by the government's concern that they will be perceived as allowing oil companies to make a killing at the country's expense. It is more normal, therefore, for governments to seek to tax them. The issue then is whether they preserve a degree of neutrality by allowing a deduction for the buyer's cost, or tax buyer and seller asymmetrically.
Approach 2 - Tax Gains and Allow the Buyer a Corresponding Deduction
Angola is an example of a country that taxes gains but allows a corresponding deduction to the buyer. Oil tax legislation in 2005 introduced this treatment for all sales of licences, including those acquired before that date. The policy is neutral in the sense that the buyer of a licence interest gets a deduction of the same amount as is taxed on the seller, but it can produce a significant advantage to the government by bringing forward cash flow. The seller's gain is taxed immediately, but the buyer's deduction is allowed by way of depreciation allowances spread over several years. Depreciation allowances, furthermore, typically do not start running until commercial production starts, so if a licence is sold during the exploration or development stage, it can be years before the buyer enjoys any benefit from the deduction. (Note also that Angola, like many other countries, allows no deduction for signature bonuses - which are often substantial - paid on the inception of a licence.)
Let's look at how our earlier simplified transaction is affected by this treatment. Say that company A has spent $300 million on exploration and development of its licence interest but has not yet received tax relief because production has not commenced. If it sells its interest to company B for $1 billion, it will be subject to tax at, say, 50% on its $700 million gain, resulting in tax of $350 million. B inherits A's entitlement to depreciation allowances on the $300 million expenditure already incurred, and also gets a deduction for $700 million (the amount of the purchase price over and above A's historic expenditure) at 50%, corresponding to A's gain. B would have a tax deduction of $700 million + $300 million at 50% = $500 million and so would, in effect, have paid $500 million while A would receive a net $650 million after taxes for an asset they had agreed was worth $1 billion.
This clearly tilts the deal in B's favour, so it would be reasonable for the parties to adjust the sale price to achieve the same net result as if the capital gain was not taxable. If the taxation of A's gain and the deduction of B's corresponding cost took effect simultaneously, this could be achieved by increasing the sale price to $1.7 billion. (A's tax liability would now be: $1.7 billion - $0.3 billion = $1.4 billion @ 50% = $0.7 billion, leaving it with the same $1 billion net proceeds as it would have received had the gain not been chargeable. B's deductions of $1.4 billion ($1.7 billion - $300 million) @ 50% would similarly leave it with the same net cost of $1 billion.) However, this serves to increase the up-front cost of the transaction by $700 million. In effect, B would be "lending" the government $700 million, which would be repaid from future tax revenues from the asset.
It becomes even more complicated though, as B's deduction would be deferred, and taken over a set period of time after production starts. Say that, compared to the $700 million tax payable by A, the net present value (NPV) of B's $700 million future tax relief was only $550 million. In effect the government would enjoy a cash flow benefit worth $150 million (the difference between today's value of $700 million and the NPV of future tax deduction of $550 million), and A and B would suffer a cash flow loss of that amount between them, which would have to be factored into their negotiations.
While, on an NPV basis, the government gains from this treatment, there are potential disadvantages to the government as well. This approach may discourage rationalisation8 of licence interests, by increasing transaction costs as shown above and, since licence transfers are often more complex than our simple example, applying the rules may be difficult to administrate. Companies may, furthermore, seek to structure transactions so as to avoid taxation of gains and the resulting cash flow loss. These disadvantages are of course even more likely to occur where a country imposes an asymmetrical tax treatment on seller and buyer, so we'll briefly consider that kind of treatment before looking at how companies might avoid taxation of gains on licence transfers.
Approach 3 - Asymmetrical Treatment of Seller and Buyer
The UK provides a prime example of asymmetrical treatment. Capital gains in general fall within a special capital gains tax (CGT) regime. Capital costs on some classes of expenditure are deductible in calculating trading income, but other capital costs - potentially including substantial costs paid for petroleum licence interests - can be deducted, if at all, only in calculating gains within the special CGT regime. CGT losses cannot be deducted against income but only against other capital gains. Then there are restrictions on loss relief on "wasting assets" - i.e. precisely those assets (such as licence interests) on which losses are most likely to arise. The CGT regime for the UK petroleum sector is subject to further "ring-fencing" restrictions. This regime is clearly designed to make it difficult for companies to obtain relief for particular kinds of capital cost or for losses on capital transactions. It is a natural target for special pleading for exemptions and for tax avoidance, and as a result the UK CGT regime has developed into a nightmare of confusion and complexity, the details of which are beyond the scope of this note. Suffice to say that the tax consequences of licence sales in the UK can be unfavourable, but in any particular case will depend on a number of complex factors, such as the company's overall CGT position, the exact nature of the transaction and of the assets included in the transfer, and the company's ability to take advantage of various legal exemptions or loopholes.
The non-neutral treatment of petroleum licence transfers in the UK is largely a by-product of its special CGT regime rather than anything specifically aimed at the oil industry. Many other countries (e.g. the US) also have special capital gains regimes, and similar asymmetrical effects can also apply to licence transfers in those countries. The precise effects depend on the exact nature of their capital gains rules (there are few countries with rules as complex and confusing as the UK's). But it is also possible for a country with no special CGT regime to impose an asymmetrical treatment specifically on transfers of petroleum licences. This approach produces more tax, and the temptation to adopt it may be greater where the government considers its existing licence terms unsatisfactory - perhaps because they were negotiated at a time when the country's prospectivity was not fully appreciated. It may be seen as giving the government a second bite at the cherry (though of course only in cases where licences are actually transferred).
Companies will often regard such asymmetrical regimes as effectively imposing double taxation. The sale value of the licence interest is the NPV of the post-tax revenues it will generate, and by taxing that value without giving relief to the buyer the government is effectively taking a further tax slice from those revenues. This slice may be very large. Taking our previous example further, if company A has to pay a tax of $350 million on its $700 million gain, but company B receives no corresponding deduction, company A will be $350 million worse off. In order to share the pain between them, the $1 billion sale price will have to be adjusted upwards - which will unfortunately increase the pain as well as share it!
Structuring Transactions to Avoid Capital Gains Tax
There is an important practical consideration that countries must keep in mind. No matter how strong the political will to tax capital gains may be, multinational companies may seek to avoid the pain of capital gains taxes in various ways. One approach is, instead of company A selling its licence interest to company B, for company A's foreign parent to sell some or all of its shareholding in company A to company B's foreign parent. (There may also be non-tax reasons for doing this.) Of course there may be all sorts of reasons why structuring a transaction in this way is difficult or unsatisfactory, but where it is possible, the transaction would fall outside the taxing legislation in many countries. Even if a country designed legislation to tax such transactions, it would likely be difficult to apply in practice and could very well be overridden by double taxation agreements. One solution is to make the purchaser liable for the seller's capital gains tax, enabling the tax liability to be settled at the closure of the transaction.
Other Challenges
Licences may be sold for non-cash consideration, for example in return for the buyer carrying out a work obligation (sometimes known as a farm-out, although that term is often used for any partial disposal of a licence interest) or by a licence swap. There may be non-tax reasons for structuring deals in this way, but tax planning may also be a factor. Theoretically, any gain should be taxed on the basis of the cash value of the non-cash consideration. However, it may be unclear whether the legislation allows that, and even if it does, the difficulty of valuing the consideration may persuade the tax authority to accept a no gain/no loss treatment for the sake of administrative simplicity. (The UK in fact introduced a legal exemption from CGT on swaps or farm-outs of undeveloped fields for exactly this reason.)
Stabilisation Clauses
A factor that may be relevant is the stabilisation clause in petroleum agreements in many countries, particularly developing ones. Sometimes these "freeze" the law in force when the licence is signed, and commonly they guarantee to make good the oil company's economic position if it is adversely affected by later changes in the law. Stabilisation clauses may limit a country's ability to introduce taxation of licence sales unfavorable to investors. Uganda and Ghana have such clauses in their agreements; Angola does not (although it is still possible that companies with agreements in place before 2005 might object to the later imposition of tax on their sale).
Whether or not a stabilisation clause applies, it must be remembered that companies normally have to obtain government consent to assign licence interests. If a company is keen to sell, the practical reality may be that it has to negotiate a deal under which it pays tax in order to win the government's consent, even though in theory it is ruled out by a stabilisation clause.
Tax Treatment of Licence Disposals in Uganda and Ghana
Capital gains are taxable under Ugandan tax law and legislation to that effect was in place when the original production sharing agreements (PSAs) were first signed. There have been two previous transactions in Uganda involving the transfer of oil and gas assets. In 2004 Tullow acquired Energy Africa for $500 million; in 2006 Tullow acquired Hardman, its partner in Uganda, for $1.1 billion in a cash and share deal. Although in both deals Ugandan assets (and assets in other parts of the world) were transferred, we understand that no capital gains tax was levied at that time.
Under Uganda's legislation it could be argued that a gain can be taxed even if it is the company that is sold rather than the licence. However, this argument isn't straightforward, and neither is collecting the tax, unless there is a provision making the successor licencee liable for any unpaid tax. So the failure to collect capital gains tax on the 2004 and 2006 transactions perhaps suggests that the Ugandans didn't pick up on the possibility of taxing the gain, or thought it wasn't worth pursuing at the time of the Energy Africa and Hardman sales, which predated the biggest discoveries of Ugandan oil.
The treatment of the prior transactions should not bind Uganda in the present case, however. It is doubtful that any country would accept that failure to tax one transaction sets a binding precedent, despite existing laws that allow for such transactions to be taxed.
In 2008 the government enacted legislation under which gains on petroleum licences were disregarded for both buyer and seller (the first approach described above). The theoretical advantages of this simple system no doubt paled when Tullow and Heritage started talking about selling licence interests for huge sums, and in September 2009 the government amended the law to tax gains but give buyers no deduction (the third approach). So when Heritage announced a sale to ENI in November 2009, it would have been taxable. Perhaps under the pressure of negotiations, the government now has a draft bill before parliament which gives the buyer a corresponding deduction (the second approach) - in effect following the Angolan CGT regime.
So Uganda has followed the whole gamut of CGT regimes and has changed the rules three times in two years. Heritage says it has had legal advice that the gain is not taxable, and is taking the issue to international arbitration; no doubt the Ugandan government has had legal advice to the contrary. The argument is likely to center on which provisions of Uganda's shifting CGT regime are relevant, how they should be interpreted and how they are affected by the stabilisation clause in the PSA. Unfortunately we are not in a position to predict the outcome as we are not privy to Heritage's legal argument. However, it does seem that there is at least a case to argue that CGT would apply given the timing of the deal relative to the legislative changes.
Ghana is also an interesting case. Its legislation appears to disregard gains in taxing a buyer and seller on the transfer of a licence after commencement of production (the first approach), but a technical case can be made that on a transfer before commencement of production, it does not tax the seller on a gain but gives the buyer a deduction for the full cost! This anomaly (which lacks any coherent rationale and falls outside the three approaches to capital gains taxation described herein) seems likely to be corrected before any disposal is permitted, and it will be interesting to see what regime eventually emerges. The government will be under the same pressure as Uganda to show some return from any major disposal, but again stabilisation clauses may come into play.
Conclusions
The capital gains made on the sale of the Heritage and Kosmos assets are high (or expected to be high in the case of a future Kosmos transaction) but not without precedent as there are previous transactions involving companies discovering new petroleum provinces in frontier areas that have shown comparable returns. There is no standard treatment for capital gains on oil and gas assets. This fact, together with the shifting nature of Uganda's tax legislation, will make arbitration challenging and the outcome hard to predict. The rules on the transfer of petroleum assets and capital gains taxation need to be clarified and included in the good governance agenda, particularly in emerging oil and gas producing countries.
Oil and gas exploration capital is increasingly deployed in a chain, from risk-tolerant small frontier exploration companies who sell out on success to larger, capital-rich development companies who may in turn sell to larger companies wanting cash generating producing assets. The key task for policymakers is to ensure the country's natural resources are developed as efficiently as possible by operating companies with the right capabilities, maximizing value for the country over the long term. While the state must clearly have the right to approve changes of licencees, policies that discourage asset transfers between companies are misguided, discourage investment and ultimately destroy value.
Governments should be mindful of the potential value created in success scenarios when it awards licences and must ensure the fiscal regime divides the value fairly and transparently between the state and the providers of risk capital. The decision on whether the state wishes to have the option of pre-production tax revenue through taxing capital gains on the sale of pre-production assets should be taken in this context and ideally before licences are awarded. This would provide greater certainty for investors and may also serve to weaken the arguments justifying controversial economic stabilisation clauses in contracts.
Acknowledgements and Disclaimer
Thanks to Richmond Energy Partners Limited for permission to publish this paper and to my tax accountant colleague who helped with the intricacies of tax law. This report does not constitute an offer to buy or sell any securities, nor does it constitute advice in relation to the buying or selling of investments, nor does it constitute a recommendation to purchase or sell securities, nor does it constitute legal or tax advice. This report does not provide a comprehensive analysis of the financial, legal and tax position, assets and liabilities, profits or losses and prospects of the company or entity that is the subject of the report and nothing in this report should be taken as comment or implication regarding the relative value of the securities of any company or entity. This report is based on the author's experience, knowledge and databases as well as publicly available sources. The author does not guarantee the accuracy of this data. The opinions expressed in this report have been arrived at after careful consideration and enquiry but we do not guarantee their fairness, completeness or accuracy. The opinions expressed are subject to change and the author does not accept liability for any reliance on them.
Download this analysis ... (pdf)
1 Dr. Keith Myers is an oil and gas industry analyst and former oil company negotiator based in London, UK. Keith is managing partner of independent research company Richmond Energy Partners Limited. He also served on the organising committee of the Chatham House Good Governance of the National Petroleum Sector project. He acts as an adviser to Revenue Watch on oil sector governance issues and has provided oil and gas governance training for parliamentarians in both Uganda and Ghana.
2 Tullow Oil press release 27th July 2010
3 FT.com, June 17th 2010
4 Source: Company reports and Richmond Energy Partners Limited analysis
5 Recycle ratio is defined here as the number of dollars returned for every dollar invested.
6 Kosmos transaction parameters are estimates only. The transaction was cancelled on the 8th August 2010.
7 Cairn Energy Press Release, 16th August 2010
8 "Rationalization," in this context, is used to mean the matching of mineral deposits--through the purchase and sale of licence interests--with the companies best able to develop them and thus most likely to provide the best returns to the government.
Notes
-
1
International Energy Agency, The Role of Critical Minerals in Clean Energy Transitions (2021), www.iea.org/reports/the-role-of-critical-minerals-in-clean-energy-transitions.
-
2
In this report we refer to both Africa north and south of the Sahara. When we mean one of the sub-regions we specify as such.
-
3
IEA (2021); Clyde Russell, “Mining is key to energy transition, but it’s still unloved,” Reuters, 11 May 2022, www.reuters.com/business/energy/mining-is-key-energy-transition-its-still-unloved-russell-2022-05-11; Jairo Yunis and Elmira Aliakbari, Annual Survey of Mining Companies 2020 (Fraser Institute, 2021), www.fraserinstitute. org/studies/annual-survey-of-mining-companies-2020.
-
4
See, for example, Natural Resource Governance Institute, Natural Resource Charter 2nd edition (2014), resourcegovernance.org/approach/natural-resource-charter.
-
5
Natural Resource Governance Institute, Resource Governance Index: From Legal Reform to Implementation in Sub-Saharan Africa (2018), resourcegovernance.org/sites/default/files/documents/rgi-from-legal-reform-to-implementation-sub-saharan-africa.pdf.
-
6
Africa Climate Foundation, Geopolitics of Critical Minerals in Renewable Energy Supply Chains (2022), africanclimatefoundation.org/news_and_analysis/geopolitics-of-critical-minerals-in-renewable-energy-supply-chains/.
-
7
See for example, Cooper Inveen, “Atlantic Lithium’s Ghana mine poised to being production by 2024,” Reuters, 20 September 2022, www.reuters.com/article/ghana-mining-lithium/atlantic-lithiums-ghana-mine-poised-to-begin-production-by-2024-idUSKBN2QV0NQ?utm_source=substack&utm_me….
-
8
As demonstrated by recent discussions between a U.S.-led group of rich countries and mineral producers such as the Democratic Republic of Congo, Namibia and Tanzania. Julian Pecquet, “US looks to Africa to
diversify supply chain for critical minerals,” The Africa Report, 23 September 2022. www.theafricareport.com/243847/us-looks-to-africa-to-diversify-supply-chain-for-critical-minerals. -
9
Glada Llahn and Paul Stevens, The curse of the one-size-fits-all fix, UNU-WIDER Working Paper (United Nations University, 2017), www.wider.unu.edu/sites/default/files/wp2017-21.pdf. For further assessment of donors’ activities in the past, both positive and negative lessons, see: Joanna Buckley, Neil McCulloch and Nick Travis, Donor-supported approaches to improving extractives governance, UNU-WIDER Working Paper (United Nations University, 2017), www.wider.unu.edu/sites/default/files/wp2017-33.pdf; Siân Herbert and Laura Bolton, Donor activity in the extractives sector (Knowledge, evidence and learning for development, 2018), opendocs.ids.ac.uk/opendocs/bitstream/handle/20.500.12413/13589/Donor_activity_in_the_extractives_sector.pdf.
-
10
Although this estimate includes emissions resulting from the investments by each group. Lucas Chancel, “Global carbon inequality over 1990–2019,” Nature Sustainability (2022), doi. org/10.1038/s41893-022-00955-z.
-
11
For Further reading on this dilemma and the arguments between the proponents of “green growth” and “degrowth, see: Alex Bowen and Samuel Fankhauser, “The Green Growth Narrative: Paradigm Shift or Just Spin? Global Environmental Change-human and Policy Dimensions,” Global Environmental Change, 21 (2021), 1157-1159, DOI: I:10.1016/j. gloenvcha.2011.07.007; Kate Raworth, Doughnut Economics: Seven Ways to Think Like a 21st Century Economist, Random House Business Books, London, 2017; Jason Hickel, “What does degrowth mean? A few points of clarification,” Globalizations, 18:7 (2021), 1105-1111, DOI: 10.1080/14747731.2020.1812222.
-
12
McKinsey & Company, “The raw-materials challenges: How the metals and mining sector will be at the core of enabling the energy transition” (2022), www.mckinsey. com/industries/metals-and-mining/our-insights/the-raw-materials-challenge-how-the-metals-and-mining-sector-will-be-at-the-core-of-enabling-the-energy-transition.
-
13
McKinsey & Company, “Metal mining constraints on the electric mobility horizon” (2018), www.mckinsey.com/industries/oil-and-gas/our-insights/metal-mining-constraints-on-the-electric-mobility-horizon.
-
14
McKinsey (2018)
-
15
NRGI analysis, based on Net Zero Tracker. “Net Zero Tracker,” Energy and Climate Intelligence Unit, Data-Driven EnviroLab, NewClimate Institute, Oxford Net Zero (2022), zerotracker.net
-
16
Pratima Desai, “Low carbon world needs $1.7 trillion in mining investment,” Reuters, 10 May 2021, www.reuters.com/business/energy/low-carbon-world-needs-17-trillion-mining-investment-2021-05-10/
-
17
Based on S&P Global Market Intelligence data and U.S. Geological Survey, Mineral Commodity Summaries 2022, 2022, www.pubs.er.usgs.gov/publication/mcs2022. These sources sometimes differ significantly. An average is taken when the reported amounts are similar. When they are not, a third source is used to determine which is likely to be more accurate.
-
18
NRGI analysis based on reserves reported in the S&P Globaldatabase and U.S. Geological Survey (2022), and the mineral volumes in a standard electric vehicle in IEA (2021).
-
19
See for example, World Bank, “New World Bank Survey Brings Hope to Malawi’s Mineral Potential,” 22 September 2015, www.worldbank.org/en/news/feature/2015/09/22/new-world-bank-survey-brings-hope-to-malawis-mineral-potential.
-
20
International Energy Agency, Global Supply Chains of EV Batteries (2022), www.iea.org/reports/global-supply-chains-of-ev-batteries.
-
21
African Minerals Development Centre (AMDC), “Unveiled: The #AMDC’s Theory of Change: A prosperous and transformed Africa achieved through sustainable development of mineral and energy resources...” Twitter post (11 October 2022), www.twitter.com/AfricanAmdc/status/1579789353584164864.
-
22
Based on S&P Global data and U.S. Geological Survey (2022). These sources sometimes differ significantly. An average is taken when the reported amounts are similar. When they are not, a third source is used to determine which is likely to be more accurate.
-
23
The correlation between exploration and mineral reserves per square kilometer is 0.79. The figure compares exploration for all metals except gold from 2002 to 2021 with current value of transition mineral reserves. Exploration spend, reserves and prices from S&P Global Market Intelligence; land area data from www.worldpopulationreview.com.
-
24
The correlation between the Resource Governance Index and Policy Potential Index scores is 0.5. The NRGI Resource Governance Index measures the transparency and accountability of mining institutions. The Policy Potential Index (PPI) in the Fraser Institute survey shows the attractiveness of a country’s policies to investors. The PPI score reported in the figure is an average of the scores from 2017 to 2021 where available, and average across jurisdictions for countries that have several. Some countries have low survey response rates, between 5 to 9 respondents. Natural Resource Governance Institute, “Resource Governance Index 2017,” 2017, resourcegovernanceindex.org; Yunis and Aliakbari (2021).
-
25
African Minerals Development Centre, Desktop Review of African Geological Survey Organisation Capacities and Gaps (United Nations Economic Commission for Africa, 2018), archive.uneca.org/publications/desktop-review-african-geological-survey-organisation-capacities-and-gaps.
-
26
Antony Sguazzin, “South Africa Sets 900 Million Annual Mineral Exploration Target,” Bloomberg, 12 April 2022, www.bloomberg.com/news/articles/2022-04-12/s-africa-sets-900-million-annual-mineral-exploration-target.
-
27
Oil exploration investment is known to correlated strongly with the quality of governance in a country, and it seems likely that a similar pattern holds for mineral exploration. See James Cust and Harding Torfinn, “Institutions and the Location of Oil Exploration”, Journal of the European Economic Association (2019).
-
28
Richard Schodde, “Key issues affecting the time delay between discovery and development – is it getting harder and longer?” PDAC 2014, 3 March 2014, Toronto. minexconsulting.com/wp-content/uploads/2019/04/Schodde-presentation-to-PDAC-March-2014.pdf
-
29
Summary of five studies. The outlier is the McKinsey study (7 to 10 years), but this was based on “large-scale greenfield assets” only. Like findings of Schodde (2021), which highlights that large projects are quicker. McKinsey (2022); IEA (2021); Tehmina Khan, Trang Nguyen, Franziska Ohnsorge, and Richard Schodde, “From Commodity Discovery to Production,” Policy Research Working Paper (World Bank, 2016); Paul Manalo, “Top mines average time from discovery to production: 16.9 years,” Metals and Mining Research S&P Global Market Intelligence (2020); Schodde (2014).
-
30
IEA (2021)
-
31
Schodde (2021) and Khan et al. (2016)
-
32
David Humphreys, “The mining industry and the supply of critical minerals,” Critical Minerals Handbook, Gus Gunn (ed.), chapter 2, 2013.
-
33
Khan et al. (2016)
-
34
Several of the experts interviewed for this report suggested that this is the main opportunity for shortening lead times.
-
35
David Manley, Patrick R.P. Heller and William Davis, No Time to Waste: Governing Cobalt Amid the Energy Transition (Natural Resource Governance Institute, 2022), resourcegovernance.org/no-time-to-waste-governing-cobalt-amid-energy-transition.
-
36
Matt Renaud and Mustafa Kumral, “Out of the Comfort Zone: Quantifying Country Risk for Foreign Mining Project Investment Feasibilities,” Mining, Metallurgy & Exploration, 38, 2323-2335 (2021), www.doi.org/10.1007/s42461-021-00495-8.
-
37
Based on S&P Global data and U.S. Geological Survey (2022). These sources sometimes differ significantly. An average is taken when the reported amounts are similar. When they are not, a third source is used to determine which is likely to be more accurate.
-
38
Henry Sanderson, “Vedanta starts arbitration against Zambia after mines seized,“ Financial Times, 31 May 2019. www.ft.com/content/98b0c464-83a1-11e9-b592-5fe435b57a3b.
-
39
Julia Tilley, “Labour talks 217: Escondida and other stories,” S&P Global Market Intelligence, Metals and Mining Research, 23 February 2017.
-
40
Keval Dhokia, “Global copper pipeline challenged due to disruption,” S&P Global Market Intelligence, Metals and Mining Research, 18 June 2019.
-
41
Sudarshan Varadhan, “Indian state seeks permanent closure of Vedanta’s copper smelter: officials,” Reuters, 24 May 2018. www.reuters.com/article/us-vedanta-smelter-idUSKCN1IP1CX.
-
42
Dhokia (2019)
-
43
Misha Savic, Jan Bratanic and Thomas Biesheuvel, “Europe’s Biggest Lithium Mine Blocked as Rio Loses in Serbia,” Bloomberg, 20 January 2022, www.bloomberg.com/news/articles/2022-01-20/serbia-suspends-rio-tinto-s-2-4-billion-lithium-mine-project.
-
44
Tanzania Minerals Audit Agency, A Study on Viability to Construct a Copper Concentrate Smelter in Tanzania (2011), www.scribd.com/document/193187016/A-Study-on-Viability-to-Construct-a-Copper-Concentrate-Smelter-in-Tanzania1.
-
45
Africa Confidential, “Local processing row holds up rare earth mine,” 25 October 2022, www.africa-confidential.com/article-preview/id/14166/Local_processing_row_holds_up_rare_earth_mine.
-
46
Reuters, “Timeline: The battle for Simandou,” 22 January 2021, www.reuters.com/article/us-swiss-steinmetz-timeline-idUSKBN29R2AA.
-
47
Magnus Ericsson and Olof Löf, “Mining’s contribution to national economies between 1996 and 2016,” Mineral Economics, 223–250 (2019), doi.org/10.1007/s13563-019-00191-6.
-
48
Net savings plus education expenditure and minus energy depletion, mineral depletion, net forest depletion, and carbon dioxide and particulate emissions damage. NRGI analysis of World Bank, “World Development Indicators,” accessed 28 September 2022, www.databank.worldbank.org/source/world-development-indicators.
-
49
Anthony J. Venables, “Using Natural Resources for Development: Why Has It Proven So Difficult?” Journal of Economic Perspectives, 30:1, 161–184 (2016) doi. org/10.1257/jep.30.1.161.
-
50
Giorgia Albertin, Boriana Yontcheva, Dan Devlin, Hilary Devine, Marc Gerard, Sebastian Beer, Irena Jankulov Suljagic and Vimal V. Thakoor, Tax Avoidance in Sub-Saharan Africa’s Mining Sector, Departmental Paper No 2021/022 (International Monetary Fund, 2021), www.imf.org/en/Publications/Departmental-Papers-Policy-Papers/Issues/2021/09/27/Tax-Avoidance-in-Sub-Saharan-Africas-Mining-Sector-464850
-
51
See for example, South African Human Rights Commission, National Hearing on the Underlying Socio-economic Challenges of Mining-affected Communities in South Africa (2016), www.sahrc.org.za/home/21/files/SAHRC%20Mining%20communities%20report%20FINAL.pdf
-
52
See, for example, Claude Kabemba, “How mineral resources can fuel the development of Africa in the context of post-Covid economic recovery,” Publish What You Pay Annual Conference, 14-15 March 2021, www.sarwatch.co.za/how-mineral-resources-can-fuel-the-development-of-africa-in-the-context-of-post-covid-economic-recovery.
-
53
See, for example, African Development Bank, Request for Expressions of Interest, 2022, www.afdb.org/sites/default/files/reoi_green_minerals_strategy_approach_paper_002.pdf.
-
54
Other partners currently include African Legal Support Facility, Africa Finance Corporation, Afreximbank, United Nations Economic Commission for Africa and United Nations Development Programme.
-
55
African Development Bank, “Why Africa is the next renewables powerhouse,” 7 December 2018, www.afdb.org/en/news-and-events/why-africa-is-the-next-renewables-powerhouse-18822
-
56
Manley et al (2022)
-
57
Through Power Africa (www.usaid.gov/powerafrica), for example.
-
58
Reserves data is from S&P Global Market Intelligence and U.S. Geological Survey. The above ground assets of a country comprise its power and transport infrastructure, human capital and other productive capabilities, level of environmental protection and investment climate. They have been converted to a regional index of 0-100.
The data is from multiple sources: African Development Bank, The Africa Infrastructure Development Index (AIDI) 2020, 2020, www.afdb.org/en/documents/economic-brief-africa-infrastructure-development-index-aidi-2020-july-2020; World Bank, “World Development Indicators”; African Development Bank, Electricity Regulatory Index (ERI) for Africa, 2021, 2021, africa-energy-portal.org/reports/electricity-regulatory-index-eri-africa-2021-edition; World Intellectual Property Organization, Global Innovation Index (GII) 2021, 2021, www.wipo.int/publications/en/details.jsp?id=4560; Harvard Growth Lab, “The Atlas of Economic Complexity,” accessed 20 September 2022, www.atlas.cid.harvard.edu/; Environmental Protection Index, “2022 Environmental Protection Index (2022),” accessed 20 September 2022, www.epi.yale.edu/; World Bank, “Doing Business 2020,” accessed 20 September 2022, www.worldbank.org/en/programs/business-enabling-environment/doing-business-legacy; S&P Global, “Control Risks Country Risk Summary,” accessed 20 September 2022, www.capitaliq.spglobal.com. -
59
Southern African Development Community and African Minerals Development Centre, Developing a Regional Mining Vision for the Southern African Development Community (SADC), 2018.
-
60
Manley et al (2022)
-
61
Emily Hersh, Alex Grant and Chris Berry, So, You Want to make Batteries Too? (Payne Institute, 2020), www.payneinstitute.mines.edu/so-you-want-to-make-batteries-better-too
-
62
Ibid.
-
63
See for example, African Development Bank, Lithium-Cobalt Value Chain Analysis for Mineral Based Industrialization in Africa (2021), www.afdb.org/en/documents/lithium-cobalt-value-chain-analysis-mineral-based-industrialization-Africa.
-
64
McKinsey & Company, Power to move: Accelerating the electric transport transition in sub-Saharan Africa (2022), www.mckinsey.com/industries/automotive-and-assembly/our-insights/power-to-move-accelerating-the-electric-transport-transition-in-sub- aharan-africa.
-
65
BloombergNEF, The Cost of Producing Battery Precursors in the DRC (2021), about. bnef.com/blog/producing-battery-materials-in-the-drc-could-lower-supply-chain-emissions-and-add-value-to-the-countrys-cobalt.
-
66
Mohua Mukherjee, India’s Mass-Market Clean Mobility Initiatives and its Unique, Customized Business Models for Light Electric Vehicles (The Oxford Institute for Energy Studies, 2022), www.oxfordenergy.org/publications/indias-mass-market-clean-mobility-initiatives-and-its-unique-customized-business-models-for-light-electric-vehicles.
-
67
Rwanda Ministry of Infrastructure, Strategic Paper on Electric Mobility Adaption in Rwanda (2021), www.mininfra.gov.rw/fileadmin/user_upload/Mininfra/Publications/Laws_Orders_and_Instructions/Transport/16062021_Strategic_Paper_for_e-mobility_adapta….
-
68
Manley et al (2022)
-
69
IEA (2022)
-
70
See for example World Gold Council, Responsible gold mining and value distribution, 2013 report (2013), www.gold.org/goldhub/research/responsible-gold-mining-and-value-distribution-2013-report.
-
71
World Gold Council (2013). Mining Shared Value has indicated these figures are representative of wider sector trends.
-
72
Jeff Geipel, Mining Shared Value, interview with authors, 25 September 2022.
-
73
Government of Canada, “Minerals Sector Employment,” January 2019, www.nrcan.gc.ca/science-data/science-research/earth-sciences/earth-sciences-resources/earth-sciences-federal-programs/minerals-sector-employment/16739; Mets Ignited, “METS in Australia,” accessed 28 September 2022, www.metsignited.org/australian-mets-sector/.
-
74
Aaron Cosbey and Isabelle Ramdoo, Guidance for Governments: Local Content Policies (Intergovernmental Forum on Mining, Minerals, Metals and Sustainable Development, 2018), igf-guidance-for-governments-local-content.pdf; International Finance Corporation, Guide to Getting Started in Local Procurement (2011), www.ifc.org/wps/wcm/connect/topics_ext_content/ifc_external_corporate_site/sustainability-at-ifc/publications/publications_handbook_guidetogettingsta…; Mining Shared Value and Engineers Without Borders, The Mining Local Procurement Reporting Mechanism (LPRM) (2017), www.miningsharedvalue.org/mininglprm.
-
75
See for example, activities of the Industrial Development Corporation (www.idc.co.za) and Anglo American’s Zimele programs (www.southafrica.angloamerican.com/our-difference/zimele)
-
76
Southern Africa Resource Watch, From Harmonisation of Policies to the Manufacturing of Lithium Batteries in Southern Africa: Collaboration between DRC and Zambia (2022), www.sarwatch.co.za/publication/from-harmonisation-of-policies-to-the-manufacturing-of-lithium-batteries-in-southern-africa-collaboration-between-drc-….
-
77
Jeff Geipel, Mining Shared Value, interview with authors, 25 September 2022.
-
78
Giorgia Albertin et al (2021). Note that the definition of mineral-dependent does not overlap with which countries have substantial reserves of transition minerals.
-
79
Ibid. The IMF estimates the 15 mineral-rich countries earned mining revenues equals 2 percent of GDP on average. This amounts to $13 billion a year.
-
80
For example, if companies were to adhere to more responsible tax practices such as the B Team Responsible Tax Principles. See The B Team, “Advancing Responsible Tax Practice,” accessed 28 September 2022, www.bteam.org/our-work/causes/governance/advancing-responsible-tax-practice.
-
81
Yannick Bouterige, Céline de Quatrebarbes and Bertrand Laporte, Mining Taxation in Africa: What Evolution in 2018? (International Centre for Tax and Development, 2020), www.ictd.ac/publication/mining-taxation-africa-recent-evolution.
-
82
Giorgia Albertin et al (2021).
-
83
For example, a study of contracts on resourcecontracts.org revealed that Burkina Faso, Burundi, Guinea, Madagascar and Mali had agreed stabilization clauses lasting 30- 34 years on average—significantly longer than necessary to ensure the bankability of projects. Intergovernmental Forum on Mining, Minerals, Metals and Sustainable Development, Insights on Incentives: Tax Competition in Mining (2019), www.iisd.org/sites/default/files/publications/insights-incentives-tax-competition-mining.pdf; Natural Resource Governance Institute, resourcecontracts.org.
-
84
NRGI analysis using S&P Global mineral reserves and price data. Prices are near-term forecasts and therefore may be elevated compared to the longer-term trend.
-
85
NRGI analysis. On average, 16 percent of mining sales revenue has gone to tax payments. See Robert Pitman and Kaisa Toroskainen, Beneath the surface: The Case for Oversight of Extractive Industry Suppliers (Natural Resource Governance Institute, 2020) resourcegovernance.org/analysis-tools/publications/beneath-surface-oversight-extractive-industry-suppliers.
This figure aligns with estimates in other studies: Olle Östensson, Local content, supply chains, and shared infrastructure, UNU-WIDER Working Paper (United Nations University, 2017), www.researchgate.net/publication/337699966_Local_content_supply_chains_and_shared_infrastructure; Price Waterhouse Coopers, Total Tax Contribution: A study of the economic contribution mining companies make to public finances (2010), www.pwc.co.uk/assets/pdf/ttc-mining-study-1.pdf. -
86
Anthony J. Venables (2016) and Natural Resource Governance Institute (2014).
-
87
NRGI (2017), “Resource Governance Index 2017.” There was a small improvement in a smaller sample of countries covered by the 2021 edition of the Resource Governance Institute.
-
88
Anna Fleming, Thomas Lassourd and David Manley, “Variable Royalties: an Answer to Volatile Mineral Prices?” in Handbook on the Future of Resource Taxation, African Tax Administration Forum and Intergovernmental Forum on Mining, Minerals, Metals and Sustainable Development (forthcoming),www.iisd.org/publications/brief/future-resource-taxation-roadmap.
-
89
Robert Pitman, “Contract Disclosure Policy and Practice Tracker,” accessed 15 October 2022, docs.google.com/spreadsheets/d/1FXEeD43jw6VYHV8yS-8KJ5-rR5l0XtKxVQZBWzr-ohY.
-
90
Based on membership of the Extractive Industries Transparency Initiative (www.eiti.org/countries).
-
91
Natural Resource Governance Institute, “Chile country profile,” accessed 5 October 2022, www.resourcegovernanceindex.org/country-profiles/CHL/mining.
-
92
Transparency International, “Corruption Perceptions Index 2021,” www.transparency.org/en/cpi/2021.
-
93
United Nations Office on Drugs and Crime, Corruption and Sustainable Development (no date), www.anticorruptionday.org/documents/actagainstcorruption/print/corr18_fs_DEVELOPMENT_en.pdf
-
94
K.C. Michaels, Louis Maréchal and Benjamin Katz, “Why is ESG so important to critical mineral supplies, and what can we do about it?” (International Energy Agency, 2022) www.iea.org/commentaries/why-is-esg-so-important-to-critical-mineral-supplies-and-what-can-we-do-about-it
-
95
Extractive Industries Transparency Initiative, Making the grade: Strengthening governance of critical minerals, www.eiti.org/documents/strengthening-governance-critical-minerals.
-
96
Extractive Industries Transparency Initiative, EITI Standard 2019, eiti.org/collections/ eiti-standard#EITI-Requirements-2019; Organisation for Economic Co-operation and Development, OECD Due Diligence Guidance for Responsible Supply Chains of Minerals from Conflict-Affected and High-Risk Areas (2016), www.oecd.org/daf/inv/mne/OECD-Due-Diligence-Guidance-Minerals-Edition3.pdf; Alexandra Gillies, Sebastian Sahla, Matthieu Salomon and Tom Shipley, Diagnosing Corruption in the Extractive Sector: A Tool for Research and Action (Natural Resource Governance Institute, 2021) www.resourcegovernance.org/analysis-tools/publications/diagnosing-corruption-extractive-sector-tool-research-and-actionrespectively.
-
97
Colombia National Mining Agency, Management and Corruption Risk Matrices of the ANM approved by the Institutional Management
and Performance Committee on 01/27/2022 (2022), www.anm.gov.co/?q=documentos_para_comentarios_ciudadania; Robert Pitman and Kaisa Toroskainen, “BHP, Others Increase Scrutiny of Subcontracting Corruption Risks” (Natural Resource Governance Institute, 2018) www.resourcegovernance.org/blog/bhp-others-increase-scrutiny-subcontracting-corruption-risks. -
98
Alexandra Gillies, “Will Extractive Companies Move Away from Corruption- Prone Intermediaries?”, (Natural Resource Governance Institute, 2019) www.resourcegovernance.org/blog/extractive-companies-corruption-intermediaries-middlemen-oil.
-
99
Natural Resource Governance Institute, Anticorruption Guidance for Partners of State-Owned Enterprises (2022), soe-anticorruption.resourcegovernance.org/chapters/avoiding-high-risk-agents
-
100
Favour Ime and Louise Russell-Prywata, “Beneficial ownership transparency and the fight against grand corruption in Nigeria” (Open Ownership, 2022), www.openownership.org/en/blog/beneficial-ownership-transparency-and-the-fight-against-grand-corruption-in-nigeria.
-
101
Nqobile Dludla, “South Africa mine dam wall collapses, Killing 1 and injuring 40,” Reuters, 11 September 2022, www.reuters.com/world/africa/south-africa-mine-dam-wall-collapses-killing-three-injuring-40-2022-09-11.
-
102
Kirsten Hund and Erik Reed, “A low-carbon future must protect the world’s forests” (World Bank, 2019), www.blogs.worldbank.org/voices/low-carbon-future-must-protect-worlds-forests.
-
103
NRGIcalculationsusingscope1,2and3 emissions (excluding fugitive methane and emissions from the combustion of coal) reported by Lindsay Delevingne, Will Glazener, Liesbet Grégoir and Kimberly Henderson, “Climate risk and decarbonisation: What every mining CEO needs to know,” McKinsey & Company, 2020 www.mckinsey.com/business-functions/sustainability/our-insights/climate-risk-and-decarbonization-what-every-mining-ceo-needs-to-know. Total global emissions are for 2019 from Climate Watch, “Global Historical Emissions,” accessed 18 September 2022, www.climatewatchdata.org/ghg-emissions?end_year=2019&start_year=1990.
-
104
See for example, Éléonore Lèbre, Martin Stringer, Kamila Svobodova, John R. Owen, Deanna Kemp, Claire Côte, Andrea Arratia-Solar and Rick K. Valenta, “The social and environmental complexities of extracting energy transition metals,” Nature Communications, 11: 4823 (2020), www.nature.com/articles/s41467-020-18661-9#MOESM1.
-
105
IEA (2021)
-
106
Ibid.
-
107
World Bank, “Climate Change Knowledge Portal,” accessed 28 September 2022, www.climateknowledgeportal.worldbank.org.
-
108
NRGI (2017)
-
109
Cameroon is one exception, with its new cadastre system preventing licenses being granted that overlap protected areas. Several companies also have a no-go policy, though only for World Heritage sites. See for example ICMM, “ICMM calls for stronger legal protection of World Heritage Sites,” 2016, www.icmm.com/en-gb/news/2016/icmm-calls-for-protection-of-world-heritage-sites.
-
110
Abbi Buxton, People and nature first: safeguards needed in mining exploration (International Institute for Environment and Development, 2021) www.iied.org/20736iied.
-
111
See for example in Colombia: Lorenzo Cotula, Investment disputes from below: whose rights matter? (International Institute for Environment and Development, 2020), www.iied.org/investment-disputes-below-whose-rights-matter.
-
112
Nicola Woodroffe and Tim Grice, Beyond Revenues: Measuring and Valuing Environmental and Social Impacts in Extractive Sector Governance (Natural Resource Governance Institute, 2019), www.resourcegovernance.org/analysis-tools/publications/beyond-revenues-measuring-environmental-social-impacts.
-
113
IFC, E&S Performance Standards (2012), www.ifc.org/wps/wcm/connect/topics_ext_content/ifc_external_corporate_site/sustainability-at-ifc/policies-standards/performance-standards; IGF, Environmental and Social Impact Assessments (2020), www.igfmining.org/our-work/environmental-and-social-impact-assessments.
-
114
Daniel Whyte, “Forest finance: how Gabon earned the first payment for conservation in Africa,” Climate Tracker, 8 December 2021, www.climatetracker.org/forest-protection-first-payment-gabon-africa.
-
115
See for example Taako Edema George, Kiemo Karatu, and Andama Edward, “An evaluation of the environmental impact assessment practice in Uganda: challenges and opportunities for achieving sustainable development,” Heliyon 6(9), 2020, www.ncbi.nlm.nih.gov/pmc/articles/PMC7505666.
-
116
See for example Organisation for Economic Co-operation and Development, Guiding Principles for Durable Extractive Contracts (2019), www.oecd.org/dev/Guiding_Principles_for_durable_ extractive_contracts.pdf; United Nations Human Rights Office
of the High Commissioner, Principles for Responsible Contracts: Integrating the Management of Human Rights Risks into State-Investor Contract Negotiations- Guidance for Negotiators (2015), www.ohchr.org/%20Documents/Publications/Principles_ResponsibleContracts_HR_PUB_15_1_EN.pdf; and NRGI (2014). -
117
See for example Reuters, “South Africa’s Gold Fields bets on solar to cut costs and carbon,” 13 October 2022, www.reuters.com/business/sustainable-business/south-africas-gold-fields-bets-solar-cut-costs-carbon-2022-10-13.
-
118
U.N. Climate Change Conference UK 2021, “Glasgow Leaders’ Declaration on Forests and Land Use,” 2021, ukcop26.org/glasgow-leaders-declaration-on-forests-and-land-use.
-
119
Frances Seymour, Tony La Vina and Kristen Hite, Evidence linking community-level tenure and forest condition: An annotated bibliography (Climate and Land Use Alliance, 2015), www.climateandlandusealliance.org/wp-content/uploads/2015/08/Community_level_tenure_and_forest_condition_bibliography.pdf.
-
120
Peter G. Veit, “9 Facts about Community Land and Climate Mitigation” (World Resources Institute, 2021) files.wri.org/d8/s3fs-public/2021-10/9-facts-about-community-land-and-climate-mitigation.pdf.
-
121
Development Bank of Southern Africa, African Environmental Assessment Legislation Handbook: Consultation Draft, 2021, www.dbsa.org/african-environmental-assessment-legislation-handbook.
-
122
United Nations Development Programme, Participatory Environmental Monitoring Committees in Mining Contexts, 2019, www.undp.org/publications/participatory-environmental-monitoring-committees-mining-contexts.
-
123
Jonathan Watts, “Murders of environment and land defenders hit record high,” The Guardian, 13 September 2021, www.theguardian.com/environment/2021/sep/13/murders-environment-land-defenders-record-high.
-
124
NRGI (2017), “Resource Governance Index 2017.” There was a small improvement in a smaller sample of countries covered by the 2021 edition of the Resource Governance Institute.
-
125
With a gold price of USD 1,600 per ounce.
-
126
With a low-profit mine and a gold price of $1,600 per ounce.
-
127
Cecilia Jamasmie, “Petra Diamonds’ stake in Williamson to shrink as part of deal with Tanzania,” Mining.com, 13 December 2021, www.mining.com/petra-diamonds-stake-in-williamson-to-shrink-as-part-of-deal-with-tanzania.
-
128
Lifezone Metals, “Kabanga Nickel Signs Framework Agreement,” 19 January 2021, www.lifezonemetals.com/kabanga-nickel-signs-framework-agreement.
-
129
Thomas Scurfield and Silas Olan’g, “Magufuli Seeks the Right Balance for Tanzania’s Mining Fiscal Regime,” NRGI, 31 January 2019, www.resourcegovernance.org/blog/magufuli-seeks-right-balance-tanzania-mining-fiscal; Thomas Scurfield, “Tanzania Strikes a Better Balance with its Mining Fiscal Regime,” NRGI, 24 June 2020, www.resourcegovernance.org/blog/tanzania-strikes-better-balance-mining-fiscal-regime.
-
130
This framework agreement was published in a document setting out Barrick’s offer to buy the shares it did not already own in Acacia Mining, the previous owner of the Bulyanhulu, Buzwagi and North Mara mines in Tanzania. See Acacia Mining and Barrick Gold, Recommended Final Offer for Acacia Mining Plc by Barrick Gold Corporation, 2019, 66–79, s25.q4cdn.com/322814910/files/doc_downloads/acacia/Acacia-2.7-announcement.pdf.
-
131
The main revenue streams are import duty, skills development levy, royalty, corporate income tax, a share of dividends and shareholder loan repayments through state equity, and dividend withholding tax.
-
132
The earlier in time a shilling (Tanzania’s official currency unit) is received, the more it is worth. This is, first, because it can be used earlier; and second, because the future is uncertain, and no one can be sure they will receive that shilling in the future. To account for this time value of money, a “discount rate” is applied. In the sharing arrangement, this would mean that if the government received a shilling in year 1, the company would need to receive more than a shilling in year 2 for the benefits to be comparable. However, given cumulation here is based on actual cash flow, the company would need to receive only a shilling in year 2 for the benefits to be shared equally.
-
133
This provision for the company to earn its minimum return before sharing is triggered means Ecuador’s mechanism is similar to an R-based cash flow tax, commonly referred to as a Brown Tax. See, e.g., Robin Broadway and Michael Keen, “Theoretical perspectives on resource tax design,” in The Taxation of Petroleum and Minerals: Principles, Problems and Practice, edited by Philip Daniel, Michael Keen and Charles McPherson (Oxford: Routledge, 2010), 13–74.
-
134
Prices are taken from World Bank, “Commodities Price Data (The Pink Sheet),” www.worldbank.org/en/research/commodity-markets.
-
135
With a gold price of $1,600 per ounce.
-
136
With a gold price of $1,600 per ounce.
-
137
With a gold price of $1,600 per ounce.
-
138
The Fraser Institute survey estimates that, unless there are extremely harmful policies, around 60 percent of an investment decision tends to be based on a country’s geology. The other 40 percent comprises of several other factors, including political stability and policy predictability (given they affect the risk that investors will not be able to secure future returns generated by their investments), a conducive business environment and the tax level. See Julio Mejia and Elmira Aliakbari, Fraser Institute Annual Survey of Mining Companies 2022, (Fraser Institute, 2023), 8, www.fraserinstitute.org/studies/annual-survey-of-mining-companies-2022.
-
139
However, information gaps make it difficult for taxes to be structured to capture all excess profit. See Jean-Franҫois Wen, Progressive Taxation of Extractive Resources as Second-Best Optimal Policy (International Monetary Fund, 2018), www.imf.org/en/Publications/WP/Issues/2018/06/13/Progressive-Taxation-of-Extractive-Resources-as-Second-Best-Optimal-Policy-45923.
-
140
Recent research provides a sense of the potential revenue loss to governments from tax avoidance. The International Monetary Fund recently estimated that sub-Saharan African mining countries could be losing between $450 and $730 million in corporate income tax a year. See Sebastian Beer and Dan Devlin, Is There Money on the Table? Evidence on the Magnitude of Profit Shifting in the Extractive Industries (International Monetary Fund, 2021), www.imf.org/en/Publications/WP/Issues/2021/01/15/Is-There-Money-on-the-Table-Evidence-on-the-Magnitude-of-Profit-Shifting-in-the-Extractive-49983.
-
141
It is perhaps surprising that Tanzania’s 50-50 sharing arrangement generates an AETR greater than 50 percent (with a discount rate of 10 percent). This is despite AETR measuring government take as the share of pre-tax profits, which is larger than “economic benefits” (given economic benefits exclude interest payments). This outcome results from the 50-50 split being based on actual cash flow. The government receives revenue before the mining company through input and production taxes that do not depend on the mine making a profit. Because of these earlier revenues, the government receives a larger share on a discounted basis.
-
142
As reported in the S&P Global database. Legal risks are “expropriation, state contract alteration and contract enforcement risks.” Tax risks are “tax increase and tax inconsistency risks.” Control Risks scores these risks as still “very high” and “high” respectively (following Tanzania’s overhaul of extractives sector laws and other actions against existing mines in 2017) but reducing.
-
143
With a discount rate of 10 percent. While Ecuador’s sharing mechanism does not account for the labor profit share because none of it will go to the government from 2024 onwards, I have included it in the AETR because it is a tax on the project. The Democratic Republic of Congo regime has an excess profits tax that is triggered for a mine when the realized price is at least 25 percent higher than the price in its feasibility study. I assumed that the feasibility study has a price of $1,300 per ounce, so the excess profits tax is not triggered.
-
144
Total benefits in this case are a project’s revenues minus operating costs and replacement capital (but not minus exploration and development capital). This cash flow represents the money available to pay back the initial investment and provide a return. The government share of it is a common measure of progressivity.
-
145
Wen, Progressive Taxation of Extractive Resources as Second-Best Optimal Policy.
-
146
With a discount rate of 10 percent. The results for only some countries are shown to clearly depict each data point. The results for all the evaluated countries can be found in my model.
-
147
Scurfield, “Tanzania Strikes a Better Balance with its Mining Fiscal Regime.”
-
148
This feature is not fully reflected in Figure 5 given that “total benefits” use a slightly different definition of profits and are based on discounted cash flows.
-
149
With a gold price of $1,600 per ounce.
-
150
For example, an average 62 percent of respondents to the Fraser Institute surveys between 2017 and 2019 said the current implementation of Tanzania’s legal system would strongly discourage investment, and 73 percent said regulatory uncertainty would. See, e.g., Ashley Stedman, Jairo Yunis and Elmira Aliakbari, Fraser Institute Annual Survey of Mining Companies 2019 (Fraser Institute, 2020), www.fraserinstitute.org/studies/annual-survey-of-mining-companies-2019.
-
151
With a low-profit mine and a gold price of $1,600 per ounce.
-
152
Tax avoidance could extend the Philippines’ recovery period, and therefore delay the payment of some taxes including import duty and interest withholding tax, given the end of the recovery period depends on the reported profitability of a mine rather than an ex-ante assessment. However, the rule that the recovery period must end five years from the start of production regardless of whether pre-production expenses have been recouped limits the extent to which it can be extended.
-
153
The merits of these measures require further scrutiny. E.g., taking a share of loan repayments could result in lenders charging a higher interest rate to ensure they still recoup their loan and a minimum return. This would not only reduce taxable income but also make it harder for the government to assess whether an interest rate is reasonable, because it would not be comparable with industry benchmarks. It can also be difficult for a government to always determine whether a loan is from a related party or not. However, these considerations are outside the scope of this analysis.
-
154
Natural Resource Governance Institute (NRGI), Natural Resource Charter, 2nd edition, 2014, resourcegovernance.org/analysis-tools/publications/natural-resource-charter-2nd-ed.
-
155
Although its exclusion of several significant taxes from the government’s share of benefits means low-profit mines may still be impacted.
-
156
With a gold price of $1,600 per ounce.
-
157
Anna Fleming, Thomas Lassourd and David Manley, “Variable Royalties: an Answer to Volatile Mineral Prices?” in Handbook on the Future of Resource Taxation, African Tax Administration Forum and Intergovernmental Forum on Mining, Minerals, Metals and Sustainable Development (forthcoming), www.iisd.org/publications/brief/future-resource-taxation-roadmap.
-
158
Ensuring that interest rates used as a comparison apply to comparable assets with a similar risk profile is challenging, but rules of this nature have been successful in reducing profit shifting in other countries. See Beer and Devlin, Is There Money on the Table?.
-
159
The main taxes listed are VAT, royalty and corporate income tax. The regime also includes a share of pre-tax profits that is currently divided between the company’s workers and the government, with the portion received by the government included in its accumulated benefits. However, a recent court ruling means that all this labor profit share will go to workers from the start of 2024 and therefore none of it will be included in government benefits.
-
160
The discount rate used is specific to each mine and based on its weighted average cost of capital (WACC). I have assumed that WACC is around 7 percent in real terms. This is based on the typical discount rate for equity shareholders used by industry and government analysts of 8 percent in real terms, and the current average cost of debt for the mining sector as reported by Aswath Damodaran, Damodaran Online, www.pages.stern.nyu.edu/~adamodar.
-
161
Republic of the Philippines, Financial or Technical Assistance Agreement, mgb.gov.ph/attachments/article/79/PFC_FTAA.pdf.
-
162
For example, some terms in the original FTAA for an OceanaGold mine differed in some areas: Republic of the Philippines, Financial or Technical Assistance Agreement with Arimco Mining Corporation, 1994, www.resourcecontracts.org/contract/ocds-591adf-2792396017. I understand that the recently signed extension to this agreement has slightly different terms again.
-
163
A template of the FARI model and a user guide that explains all the concepts and workings of the model are available at International Monetary Fund, “Fiscal Analysis of Resource Industries,”www.imf.org/external/np/fad/fari.
Natural Resource Charter (2nd ed.)
The Natural Resource Charter is a set of principles to guide governments' and societies' use of natural resources so these economic opportunities result in maximum and sustained returns for a country's citizens. It outlines tools and policy options designed to avoid the mismanagement of diminishing natural riches, and ensure their ongoing benefits.
The charter is organized around 12 core precepts offering guidance on key decisions governments face, beginning with whether to extract resources and ending with how generated revenue can produce maximum good for citizens.
First launched in 2010 at the annual meetings of the International Monetary Fund and the World Bank, the charter was written by an independent group of practitioners and academics, under the governance of an oversight board composed of distinguished international figures with first-hand experience of the challenges faced by resource-rich countries. It relaunched at the 2014 Natural Resource Charter Conference in Oxford, England.
See More:
 Natural Resource Charter - Arabic (2mb)
 Natural Resource Charter - Bahasa Indonesia (305kb)
 Natural Resource Charter - French (310kb)
 Natural Resource Charter - Mongolian (630kb)
 Natural Resource Charter - Russian (431kb)
 Natural Resource Charter - Spanish (301kb)
The charter's framework and body of experts form an integral part of the Natural Resource Governance Institute.
Read more about the framework and its applications around the world.
Notes
-
1
International Energy Agency, The Role of Critical Minerals in Clean Energy Transitions (2021), www.iea.org/reports/the-role-of-critical-minerals-in-clean-energy-transitions.
-
2
In this report we refer to both Africa north and south of the Sahara. When we mean one of the sub-regions we specify as such.
-
3
IEA (2021); Clyde Russell, “Mining is key to energy transition, but it’s still unloved,” Reuters, 11 May 2022, www.reuters.com/business/energy/mining-is-key-energy-transition-its-still-unloved-russell-2022-05-11; Jairo Yunis and Elmira Aliakbari, Annual Survey of Mining Companies 2020 (Fraser Institute, 2021), www.fraserinstitute. org/studies/annual-survey-of-mining-companies-2020.
-
4
See, for example, Natural Resource Governance Institute, Natural Resource Charter 2nd edition (2014), resourcegovernance.org/approach/natural-resource-charter.
-
5
Natural Resource Governance Institute, Resource Governance Index: From Legal Reform to Implementation in Sub-Saharan Africa (2018), resourcegovernance.org/sites/default/files/documents/rgi-from-legal-reform-to-implementation-sub-saharan-africa.pdf.
-
6
Africa Climate Foundation, Geopolitics of Critical Minerals in Renewable Energy Supply Chains (2022), africanclimatefoundation.org/news_and_analysis/geopolitics-of-critical-minerals-in-renewable-energy-supply-chains/.
-
7
See for example, Cooper Inveen, “Atlantic Lithium’s Ghana mine poised to being production by 2024,” Reuters, 20 September 2022, www.reuters.com/article/ghana-mining-lithium/atlantic-lithiums-ghana-mine-poised-to-begin-production-by-2024-idUSKBN2QV0NQ?utm_source=substack&utm_me….
-
8
As demonstrated by recent discussions between a U.S.-led group of rich countries and mineral producers such as the Democratic Republic of Congo, Namibia and Tanzania. Julian Pecquet, “US looks to Africa to
diversify supply chain for critical minerals,” The Africa Report, 23 September 2022. www.theafricareport.com/243847/us-looks-to-africa-to-diversify-supply-chain-for-critical-minerals. -
9
Glada Llahn and Paul Stevens, The curse of the one-size-fits-all fix, UNU-WIDER Working Paper (United Nations University, 2017), www.wider.unu.edu/sites/default/files/wp2017-21.pdf. For further assessment of donors’ activities in the past, both positive and negative lessons, see: Joanna Buckley, Neil McCulloch and Nick Travis, Donor-supported approaches to improving extractives governance, UNU-WIDER Working Paper (United Nations University, 2017), www.wider.unu.edu/sites/default/files/wp2017-33.pdf; Siân Herbert and Laura Bolton, Donor activity in the extractives sector (Knowledge, evidence and learning for development, 2018), opendocs.ids.ac.uk/opendocs/bitstream/handle/20.500.12413/13589/Donor_activity_in_the_extractives_sector.pdf.
-
10
Although this estimate includes emissions resulting from the investments by each group. Lucas Chancel, “Global carbon inequality over 1990–2019,” Nature Sustainability (2022), doi. org/10.1038/s41893-022-00955-z.
-
11
For Further reading on this dilemma and the arguments between the proponents of “green growth” and “degrowth, see: Alex Bowen and Samuel Fankhauser, “The Green Growth Narrative: Paradigm Shift or Just Spin? Global Environmental Change-human and Policy Dimensions,” Global Environmental Change, 21 (2021), 1157-1159, DOI: I:10.1016/j. gloenvcha.2011.07.007; Kate Raworth, Doughnut Economics: Seven Ways to Think Like a 21st Century Economist, Random House Business Books, London, 2017; Jason Hickel, “What does degrowth mean? A few points of clarification,” Globalizations, 18:7 (2021), 1105-1111, DOI: 10.1080/14747731.2020.1812222.
-
12
McKinsey & Company, “The raw-materials challenges: How the metals and mining sector will be at the core of enabling the energy transition” (2022), www.mckinsey. com/industries/metals-and-mining/our-insights/the-raw-materials-challenge-how-the-metals-and-mining-sector-will-be-at-the-core-of-enabling-the-energy-transition.
-
13
McKinsey & Company, “Metal mining constraints on the electric mobility horizon” (2018), www.mckinsey.com/industries/oil-and-gas/our-insights/metal-mining-constraints-on-the-electric-mobility-horizon.
-
14
McKinsey (2018)
-
15
NRGI analysis, based on Net Zero Tracker. “Net Zero Tracker,” Energy and Climate Intelligence Unit, Data-Driven EnviroLab, NewClimate Institute, Oxford Net Zero (2022), zerotracker.net
-
16
Pratima Desai, “Low carbon world needs $1.7 trillion in mining investment,” Reuters, 10 May 2021, www.reuters.com/business/energy/low-carbon-world-needs-17-trillion-mining-investment-2021-05-10/
-
17
Based on S&P Global Market Intelligence data and U.S. Geological Survey, Mineral Commodity Summaries 2022, 2022, www.pubs.er.usgs.gov/publication/mcs2022. These sources sometimes differ significantly. An average is taken when the reported amounts are similar. When they are not, a third source is used to determine which is likely to be more accurate.
-
18
NRGI analysis based on reserves reported in the S&P Globaldatabase and U.S. Geological Survey (2022), and the mineral volumes in a standard electric vehicle in IEA (2021).
-
19
See for example, World Bank, “New World Bank Survey Brings Hope to Malawi’s Mineral Potential,” 22 September 2015, www.worldbank.org/en/news/feature/2015/09/22/new-world-bank-survey-brings-hope-to-malawis-mineral-potential.
-
20
International Energy Agency, Global Supply Chains of EV Batteries (2022), www.iea.org/reports/global-supply-chains-of-ev-batteries.
-
21
African Minerals Development Centre (AMDC), “Unveiled: The #AMDC’s Theory of Change: A prosperous and transformed Africa achieved through sustainable development of mineral and energy resources...” Twitter post (11 October 2022), www.twitter.com/AfricanAmdc/status/1579789353584164864.
-
22
Based on S&P Global data and U.S. Geological Survey (2022). These sources sometimes differ significantly. An average is taken when the reported amounts are similar. When they are not, a third source is used to determine which is likely to be more accurate.
-
23
The correlation between exploration and mineral reserves per square kilometer is 0.79. The figure compares exploration for all metals except gold from 2002 to 2021 with current value of transition mineral reserves. Exploration spend, reserves and prices from S&P Global Market Intelligence; land area data from www.worldpopulationreview.com.
-
24
The correlation between the Resource Governance Index and Policy Potential Index scores is 0.5. The NRGI Resource Governance Index measures the transparency and accountability of mining institutions. The Policy Potential Index (PPI) in the Fraser Institute survey shows the attractiveness of a country’s policies to investors. The PPI score reported in the figure is an average of the scores from 2017 to 2021 where available, and average across jurisdictions for countries that have several. Some countries have low survey response rates, between 5 to 9 respondents. Natural Resource Governance Institute, “Resource Governance Index 2017,” 2017, resourcegovernanceindex.org; Yunis and Aliakbari (2021).
-
25
African Minerals Development Centre, Desktop Review of African Geological Survey Organisation Capacities and Gaps (United Nations Economic Commission for Africa, 2018), archive.uneca.org/publications/desktop-review-african-geological-survey-organisation-capacities-and-gaps.
-
26
Antony Sguazzin, “South Africa Sets 900 Million Annual Mineral Exploration Target,” Bloomberg, 12 April 2022, www.bloomberg.com/news/articles/2022-04-12/s-africa-sets-900-million-annual-mineral-exploration-target.
-
27
Oil exploration investment is known to correlated strongly with the quality of governance in a country, and it seems likely that a similar pattern holds for mineral exploration. See James Cust and Harding Torfinn, “Institutions and the Location of Oil Exploration”, Journal of the European Economic Association (2019).
-
28
Richard Schodde, “Key issues affecting the time delay between discovery and development – is it getting harder and longer?” PDAC 2014, 3 March 2014, Toronto. minexconsulting.com/wp-content/uploads/2019/04/Schodde-presentation-to-PDAC-March-2014.pdf
-
29
Summary of five studies. The outlier is the McKinsey study (7 to 10 years), but this was based on “large-scale greenfield assets” only. Like findings of Schodde (2021), which highlights that large projects are quicker. McKinsey (2022); IEA (2021); Tehmina Khan, Trang Nguyen, Franziska Ohnsorge, and Richard Schodde, “From Commodity Discovery to Production,” Policy Research Working Paper (World Bank, 2016); Paul Manalo, “Top mines average time from discovery to production: 16.9 years,” Metals and Mining Research S&P Global Market Intelligence (2020); Schodde (2014).
-
30
IEA (2021)
-
31
Schodde (2021) and Khan et al. (2016)
-
32
David Humphreys, “The mining industry and the supply of critical minerals,” Critical Minerals Handbook, Gus Gunn (ed.), chapter 2, 2013.
-
33
Khan et al. (2016)
-
34
Several of the experts interviewed for this report suggested that this is the main opportunity for shortening lead times.
-
35
David Manley, Patrick R.P. Heller and William Davis, No Time to Waste: Governing Cobalt Amid the Energy Transition (Natural Resource Governance Institute, 2022), resourcegovernance.org/no-time-to-waste-governing-cobalt-amid-energy-transition.
-
36
Matt Renaud and Mustafa Kumral, “Out of the Comfort Zone: Quantifying Country Risk for Foreign Mining Project Investment Feasibilities,” Mining, Metallurgy & Exploration, 38, 2323-2335 (2021), www.doi.org/10.1007/s42461-021-00495-8.
-
37
Based on S&P Global data and U.S. Geological Survey (2022). These sources sometimes differ significantly. An average is taken when the reported amounts are similar. When they are not, a third source is used to determine which is likely to be more accurate.
-
38
Henry Sanderson, “Vedanta starts arbitration against Zambia after mines seized,“ Financial Times, 31 May 2019. www.ft.com/content/98b0c464-83a1-11e9-b592-5fe435b57a3b.
-
39
Julia Tilley, “Labour talks 217: Escondida and other stories,” S&P Global Market Intelligence, Metals and Mining Research, 23 February 2017.
-
40
Keval Dhokia, “Global copper pipeline challenged due to disruption,” S&P Global Market Intelligence, Metals and Mining Research, 18 June 2019.
-
41
Sudarshan Varadhan, “Indian state seeks permanent closure of Vedanta’s copper smelter: officials,” Reuters, 24 May 2018. www.reuters.com/article/us-vedanta-smelter-idUSKCN1IP1CX.
-
42
Dhokia (2019)
-
43
Misha Savic, Jan Bratanic and Thomas Biesheuvel, “Europe’s Biggest Lithium Mine Blocked as Rio Loses in Serbia,” Bloomberg, 20 January 2022, www.bloomberg.com/news/articles/2022-01-20/serbia-suspends-rio-tinto-s-2-4-billion-lithium-mine-project.
-
44
Tanzania Minerals Audit Agency, A Study on Viability to Construct a Copper Concentrate Smelter in Tanzania (2011), www.scribd.com/document/193187016/A-Study-on-Viability-to-Construct-a-Copper-Concentrate-Smelter-in-Tanzania1.
-
45
Africa Confidential, “Local processing row holds up rare earth mine,” 25 October 2022, www.africa-confidential.com/article-preview/id/14166/Local_processing_row_holds_up_rare_earth_mine.
-
46
Reuters, “Timeline: The battle for Simandou,” 22 January 2021, www.reuters.com/article/us-swiss-steinmetz-timeline-idUSKBN29R2AA.
-
47
Magnus Ericsson and Olof Löf, “Mining’s contribution to national economies between 1996 and 2016,” Mineral Economics, 223–250 (2019), doi.org/10.1007/s13563-019-00191-6.
-
48
Net savings plus education expenditure and minus energy depletion, mineral depletion, net forest depletion, and carbon dioxide and particulate emissions damage. NRGI analysis of World Bank, “World Development Indicators,” accessed 28 September 2022, www.databank.worldbank.org/source/world-development-indicators.
-
49
Anthony J. Venables, “Using Natural Resources for Development: Why Has It Proven So Difficult?” Journal of Economic Perspectives, 30:1, 161–184 (2016) doi. org/10.1257/jep.30.1.161.
-
50
Giorgia Albertin, Boriana Yontcheva, Dan Devlin, Hilary Devine, Marc Gerard, Sebastian Beer, Irena Jankulov Suljagic and Vimal V. Thakoor, Tax Avoidance in Sub-Saharan Africa’s Mining Sector, Departmental Paper No 2021/022 (International Monetary Fund, 2021), www.imf.org/en/Publications/Departmental-Papers-Policy-Papers/Issues/2021/09/27/Tax-Avoidance-in-Sub-Saharan-Africas-Mining-Sector-464850
-
51
See for example, South African Human Rights Commission, National Hearing on the Underlying Socio-economic Challenges of Mining-affected Communities in South Africa (2016), www.sahrc.org.za/home/21/files/SAHRC%20Mining%20communities%20report%20FINAL.pdf
-
52
See, for example, Claude Kabemba, “How mineral resources can fuel the development of Africa in the context of post-Covid economic recovery,” Publish What You Pay Annual Conference, 14-15 March 2021, www.sarwatch.co.za/how-mineral-resources-can-fuel-the-development-of-africa-in-the-context-of-post-covid-economic-recovery.
-
53
See, for example, African Development Bank, Request for Expressions of Interest, 2022, www.afdb.org/sites/default/files/reoi_green_minerals_strategy_approach_paper_002.pdf.
-
54
Other partners currently include African Legal Support Facility, Africa Finance Corporation, Afreximbank, United Nations Economic Commission for Africa and United Nations Development Programme.
-
55
African Development Bank, “Why Africa is the next renewables powerhouse,” 7 December 2018, www.afdb.org/en/news-and-events/why-africa-is-the-next-renewables-powerhouse-18822
-
56
Manley et al (2022)
-
57
Through Power Africa (www.usaid.gov/powerafrica), for example.
-
58
Reserves data is from S&P Global Market Intelligence and U.S. Geological Survey. The above ground assets of a country comprise its power and transport infrastructure, human capital and other productive capabilities, level of environmental protection and investment climate. They have been converted to a regional index of 0-100.
The data is from multiple sources: African Development Bank, The Africa Infrastructure Development Index (AIDI) 2020, 2020, www.afdb.org/en/documents/economic-brief-africa-infrastructure-development-index-aidi-2020-july-2020; World Bank, “World Development Indicators”; African Development Bank, Electricity Regulatory Index (ERI) for Africa, 2021, 2021, africa-energy-portal.org/reports/electricity-regulatory-index-eri-africa-2021-edition; World Intellectual Property Organization, Global Innovation Index (GII) 2021, 2021, www.wipo.int/publications/en/details.jsp?id=4560; Harvard Growth Lab, “The Atlas of Economic Complexity,” accessed 20 September 2022, www.atlas.cid.harvard.edu/; Environmental Protection Index, “2022 Environmental Protection Index (2022),” accessed 20 September 2022, www.epi.yale.edu/; World Bank, “Doing Business 2020,” accessed 20 September 2022, www.worldbank.org/en/programs/business-enabling-environment/doing-business-legacy; S&P Global, “Control Risks Country Risk Summary,” accessed 20 September 2022, www.capitaliq.spglobal.com. -
59
Southern African Development Community and African Minerals Development Centre, Developing a Regional Mining Vision for the Southern African Development Community (SADC), 2018.
-
60
Manley et al (2022)
-
61
Emily Hersh, Alex Grant and Chris Berry, So, You Want to make Batteries Too? (Payne Institute, 2020), www.payneinstitute.mines.edu/so-you-want-to-make-batteries-better-too
-
62
Ibid.
-
63
See for example, African Development Bank, Lithium-Cobalt Value Chain Analysis for Mineral Based Industrialization in Africa (2021), www.afdb.org/en/documents/lithium-cobalt-value-chain-analysis-mineral-based-industrialization-Africa.
-
64
McKinsey & Company, Power to move: Accelerating the electric transport transition in sub-Saharan Africa (2022), www.mckinsey.com/industries/automotive-and-assembly/our-insights/power-to-move-accelerating-the-electric-transport-transition-in-sub- aharan-africa.
-
65
BloombergNEF, The Cost of Producing Battery Precursors in the DRC (2021), about. bnef.com/blog/producing-battery-materials-in-the-drc-could-lower-supply-chain-emissions-and-add-value-to-the-countrys-cobalt.
-
66
Mohua Mukherjee, India’s Mass-Market Clean Mobility Initiatives and its Unique, Customized Business Models for Light Electric Vehicles (The Oxford Institute for Energy Studies, 2022), www.oxfordenergy.org/publications/indias-mass-market-clean-mobility-initiatives-and-its-unique-customized-business-models-for-light-electric-vehicles.
-
67
Rwanda Ministry of Infrastructure, Strategic Paper on Electric Mobility Adaption in Rwanda (2021), www.mininfra.gov.rw/fileadmin/user_upload/Mininfra/Publications/Laws_Orders_and_Instructions/Transport/16062021_Strategic_Paper_for_e-mobility_adapta….
-
68
Manley et al (2022)
-
69
IEA (2022)
-
70
See for example World Gold Council, Responsible gold mining and value distribution, 2013 report (2013), www.gold.org/goldhub/research/responsible-gold-mining-and-value-distribution-2013-report.
-
71
World Gold Council (2013). Mining Shared Value has indicated these figures are representative of wider sector trends.
-
72
Jeff Geipel, Mining Shared Value, interview with authors, 25 September 2022.
-
73
Government of Canada, “Minerals Sector Employment,” January 2019, www.nrcan.gc.ca/science-data/science-research/earth-sciences/earth-sciences-resources/earth-sciences-federal-programs/minerals-sector-employment/16739; Mets Ignited, “METS in Australia,” accessed 28 September 2022, www.metsignited.org/australian-mets-sector/.
-
74
Aaron Cosbey and Isabelle Ramdoo, Guidance for Governments: Local Content Policies (Intergovernmental Forum on Mining, Minerals, Metals and Sustainable Development, 2018), igf-guidance-for-governments-local-content.pdf; International Finance Corporation, Guide to Getting Started in Local Procurement (2011), www.ifc.org/wps/wcm/connect/topics_ext_content/ifc_external_corporate_site/sustainability-at-ifc/publications/publications_handbook_guidetogettingsta…; Mining Shared Value and Engineers Without Borders, The Mining Local Procurement Reporting Mechanism (LPRM) (2017), www.miningsharedvalue.org/mininglprm.
-
75
See for example, activities of the Industrial Development Corporation (www.idc.co.za) and Anglo American’s Zimele programs (www.southafrica.angloamerican.com/our-difference/zimele)
-
76
Southern Africa Resource Watch, From Harmonisation of Policies to the Manufacturing of Lithium Batteries in Southern Africa: Collaboration between DRC and Zambia (2022), www.sarwatch.co.za/publication/from-harmonisation-of-policies-to-the-manufacturing-of-lithium-batteries-in-southern-africa-collaboration-between-drc-….
-
77
Jeff Geipel, Mining Shared Value, interview with authors, 25 September 2022.
-
78
Giorgia Albertin et al (2021). Note that the definition of mineral-dependent does not overlap with which countries have substantial reserves of transition minerals.
-
79
Ibid. The IMF estimates the 15 mineral-rich countries earned mining revenues equals 2 percent of GDP on average. This amounts to $13 billion a year.
-
80
For example, if companies were to adhere to more responsible tax practices such as the B Team Responsible Tax Principles. See The B Team, “Advancing Responsible Tax Practice,” accessed 28 September 2022, www.bteam.org/our-work/causes/governance/advancing-responsible-tax-practice.
-
81
Yannick Bouterige, Céline de Quatrebarbes and Bertrand Laporte, Mining Taxation in Africa: What Evolution in 2018? (International Centre for Tax and Development, 2020), www.ictd.ac/publication/mining-taxation-africa-recent-evolution.
-
82
Giorgia Albertin et al (2021).
-
83
For example, a study of contracts on resourcecontracts.org revealed that Burkina Faso, Burundi, Guinea, Madagascar and Mali had agreed stabilization clauses lasting 30- 34 years on average—significantly longer than necessary to ensure the bankability of projects. Intergovernmental Forum on Mining, Minerals, Metals and Sustainable Development, Insights on Incentives: Tax Competition in Mining (2019), www.iisd.org/sites/default/files/publications/insights-incentives-tax-competition-mining.pdf; Natural Resource Governance Institute, resourcecontracts.org.
-
84
NRGI analysis using S&P Global mineral reserves and price data. Prices are near-term forecasts and therefore may be elevated compared to the longer-term trend.
-
85
NRGI analysis. On average, 16 percent of mining sales revenue has gone to tax payments. See Robert Pitman and Kaisa Toroskainen, Beneath the surface: The Case for Oversight of Extractive Industry Suppliers (Natural Resource Governance Institute, 2020) resourcegovernance.org/analysis-tools/publications/beneath-surface-oversight-extractive-industry-suppliers.
This figure aligns with estimates in other studies: Olle Östensson, Local content, supply chains, and shared infrastructure, UNU-WIDER Working Paper (United Nations University, 2017), www.researchgate.net/publication/337699966_Local_content_supply_chains_and_shared_infrastructure; Price Waterhouse Coopers, Total Tax Contribution: A study of the economic contribution mining companies make to public finances (2010), www.pwc.co.uk/assets/pdf/ttc-mining-study-1.pdf. -
86
Anthony J. Venables (2016) and Natural Resource Governance Institute (2014).
-
87
NRGI (2017), “Resource Governance Index 2017.” There was a small improvement in a smaller sample of countries covered by the 2021 edition of the Resource Governance Institute.
-
88
Anna Fleming, Thomas Lassourd and David Manley, “Variable Royalties: an Answer to Volatile Mineral Prices?” in Handbook on the Future of Resource Taxation, African Tax Administration Forum and Intergovernmental Forum on Mining, Minerals, Metals and Sustainable Development (forthcoming),www.iisd.org/publications/brief/future-resource-taxation-roadmap.
-
89
Robert Pitman, “Contract Disclosure Policy and Practice Tracker,” accessed 15 October 2022, docs.google.com/spreadsheets/d/1FXEeD43jw6VYHV8yS-8KJ5-rR5l0XtKxVQZBWzr-ohY.
-
90
Based on membership of the Extractive Industries Transparency Initiative (www.eiti.org/countries).
-
91
Natural Resource Governance Institute, “Chile country profile,” accessed 5 October 2022, www.resourcegovernanceindex.org/country-profiles/CHL/mining.
-
92
Transparency International, “Corruption Perceptions Index 2021,” www.transparency.org/en/cpi/2021.
-
93
United Nations Office on Drugs and Crime, Corruption and Sustainable Development (no date), www.anticorruptionday.org/documents/actagainstcorruption/print/corr18_fs_DEVELOPMENT_en.pdf
-
94
K.C. Michaels, Louis Maréchal and Benjamin Katz, “Why is ESG so important to critical mineral supplies, and what can we do about it?” (International Energy Agency, 2022) www.iea.org/commentaries/why-is-esg-so-important-to-critical-mineral-supplies-and-what-can-we-do-about-it
-
95
Extractive Industries Transparency Initiative, Making the grade: Strengthening governance of critical minerals, www.eiti.org/documents/strengthening-governance-critical-minerals.
-
96
Extractive Industries Transparency Initiative, EITI Standard 2019, eiti.org/collections/ eiti-standard#EITI-Requirements-2019; Organisation for Economic Co-operation and Development, OECD Due Diligence Guidance for Responsible Supply Chains of Minerals from Conflict-Affected and High-Risk Areas (2016), www.oecd.org/daf/inv/mne/OECD-Due-Diligence-Guidance-Minerals-Edition3.pdf; Alexandra Gillies, Sebastian Sahla, Matthieu Salomon and Tom Shipley, Diagnosing Corruption in the Extractive Sector: A Tool for Research and Action (Natural Resource Governance Institute, 2021) www.resourcegovernance.org/analysis-tools/publications/diagnosing-corruption-extractive-sector-tool-research-and-actionrespectively.
-
97
Colombia National Mining Agency, Management and Corruption Risk Matrices of the ANM approved by the Institutional Management
and Performance Committee on 01/27/2022 (2022), www.anm.gov.co/?q=documentos_para_comentarios_ciudadania; Robert Pitman and Kaisa Toroskainen, “BHP, Others Increase Scrutiny of Subcontracting Corruption Risks” (Natural Resource Governance Institute, 2018) www.resourcegovernance.org/blog/bhp-others-increase-scrutiny-subcontracting-corruption-risks. -
98
Alexandra Gillies, “Will Extractive Companies Move Away from Corruption- Prone Intermediaries?”, (Natural Resource Governance Institute, 2019) www.resourcegovernance.org/blog/extractive-companies-corruption-intermediaries-middlemen-oil.
-
99
Natural Resource Governance Institute, Anticorruption Guidance for Partners of State-Owned Enterprises (2022), soe-anticorruption.resourcegovernance.org/chapters/avoiding-high-risk-agents
-
100
Favour Ime and Louise Russell-Prywata, “Beneficial ownership transparency and the fight against grand corruption in Nigeria” (Open Ownership, 2022), www.openownership.org/en/blog/beneficial-ownership-transparency-and-the-fight-against-grand-corruption-in-nigeria.
-
101
Nqobile Dludla, “South Africa mine dam wall collapses, Killing 1 and injuring 40,” Reuters, 11 September 2022, www.reuters.com/world/africa/south-africa-mine-dam-wall-collapses-killing-three-injuring-40-2022-09-11.
-
102
Kirsten Hund and Erik Reed, “A low-carbon future must protect the world’s forests” (World Bank, 2019), www.blogs.worldbank.org/voices/low-carbon-future-must-protect-worlds-forests.
-
103
NRGIcalculationsusingscope1,2and3 emissions (excluding fugitive methane and emissions from the combustion of coal) reported by Lindsay Delevingne, Will Glazener, Liesbet Grégoir and Kimberly Henderson, “Climate risk and decarbonisation: What every mining CEO needs to know,” McKinsey & Company, 2020 www.mckinsey.com/business-functions/sustainability/our-insights/climate-risk-and-decarbonization-what-every-mining-ceo-needs-to-know. Total global emissions are for 2019 from Climate Watch, “Global Historical Emissions,” accessed 18 September 2022, www.climatewatchdata.org/ghg-emissions?end_year=2019&start_year=1990.
-
104
See for example, Éléonore Lèbre, Martin Stringer, Kamila Svobodova, John R. Owen, Deanna Kemp, Claire Côte, Andrea Arratia-Solar and Rick K. Valenta, “The social and environmental complexities of extracting energy transition metals,” Nature Communications, 11: 4823 (2020), www.nature.com/articles/s41467-020-18661-9#MOESM1.
-
105
IEA (2021)
-
106
Ibid.
-
107
World Bank, “Climate Change Knowledge Portal,” accessed 28 September 2022, www.climateknowledgeportal.worldbank.org.
-
108
NRGI (2017)
-
109
Cameroon is one exception, with its new cadastre system preventing licenses being granted that overlap protected areas. Several companies also have a no-go policy, though only for World Heritage sites. See for example ICMM, “ICMM calls for stronger legal protection of World Heritage Sites,” 2016, www.icmm.com/en-gb/news/2016/icmm-calls-for-protection-of-world-heritage-sites.
-
110
Abbi Buxton, People and nature first: safeguards needed in mining exploration (International Institute for Environment and Development, 2021) www.iied.org/20736iied.
-
111
See for example in Colombia: Lorenzo Cotula, Investment disputes from below: whose rights matter? (International Institute for Environment and Development, 2020), www.iied.org/investment-disputes-below-whose-rights-matter.
-
112
Nicola Woodroffe and Tim Grice, Beyond Revenues: Measuring and Valuing Environmental and Social Impacts in Extractive Sector Governance (Natural Resource Governance Institute, 2019), www.resourcegovernance.org/analysis-tools/publications/beyond-revenues-measuring-environmental-social-impacts.
-
113
IFC, E&S Performance Standards (2012), www.ifc.org/wps/wcm/connect/topics_ext_content/ifc_external_corporate_site/sustainability-at-ifc/policies-standards/performance-standards; IGF, Environmental and Social Impact Assessments (2020), www.igfmining.org/our-work/environmental-and-social-impact-assessments.
-
114
Daniel Whyte, “Forest finance: how Gabon earned the first payment for conservation in Africa,” Climate Tracker, 8 December 2021, www.climatetracker.org/forest-protection-first-payment-gabon-africa.
-
115
See for example Taako Edema George, Kiemo Karatu, and Andama Edward, “An evaluation of the environmental impact assessment practice in Uganda: challenges and opportunities for achieving sustainable development,” Heliyon 6(9), 2020, www.ncbi.nlm.nih.gov/pmc/articles/PMC7505666.
-
116
See for example Organisation for Economic Co-operation and Development, Guiding Principles for Durable Extractive Contracts (2019), www.oecd.org/dev/Guiding_Principles_for_durable_ extractive_contracts.pdf; United Nations Human Rights Office
of the High Commissioner, Principles for Responsible Contracts: Integrating the Management of Human Rights Risks into State-Investor Contract Negotiations- Guidance for Negotiators (2015), www.ohchr.org/%20Documents/Publications/Principles_ResponsibleContracts_HR_PUB_15_1_EN.pdf; and NRGI (2014). -
117
See for example Reuters, “South Africa’s Gold Fields bets on solar to cut costs and carbon,” 13 October 2022, www.reuters.com/business/sustainable-business/south-africas-gold-fields-bets-solar-cut-costs-carbon-2022-10-13.
-
118
U.N. Climate Change Conference UK 2021, “Glasgow Leaders’ Declaration on Forests and Land Use,” 2021, ukcop26.org/glasgow-leaders-declaration-on-forests-and-land-use.
-
119
Frances Seymour, Tony La Vina and Kristen Hite, Evidence linking community-level tenure and forest condition: An annotated bibliography (Climate and Land Use Alliance, 2015), www.climateandlandusealliance.org/wp-content/uploads/2015/08/Community_level_tenure_and_forest_condition_bibliography.pdf.
-
120
Peter G. Veit, “9 Facts about Community Land and Climate Mitigation” (World Resources Institute, 2021) files.wri.org/d8/s3fs-public/2021-10/9-facts-about-community-land-and-climate-mitigation.pdf.
-
121
Development Bank of Southern Africa, African Environmental Assessment Legislation Handbook: Consultation Draft, 2021, www.dbsa.org/african-environmental-assessment-legislation-handbook.
-
122
United Nations Development Programme, Participatory Environmental Monitoring Committees in Mining Contexts, 2019, www.undp.org/publications/participatory-environmental-monitoring-committees-mining-contexts.
-
123
Jonathan Watts, “Murders of environment and land defenders hit record high,” The Guardian, 13 September 2021, www.theguardian.com/environment/2021/sep/13/murders-environment-land-defenders-record-high.
-
124
NRGI (2017), “Resource Governance Index 2017.” There was a small improvement in a smaller sample of countries covered by the 2021 edition of the Resource Governance Institute.
-
125
With a gold price of USD 1,600 per ounce.
-
126
With a low-profit mine and a gold price of $1,600 per ounce.
-
127
Cecilia Jamasmie, “Petra Diamonds’ stake in Williamson to shrink as part of deal with Tanzania,” Mining.com, 13 December 2021, www.mining.com/petra-diamonds-stake-in-williamson-to-shrink-as-part-of-deal-with-tanzania.
-
128
Lifezone Metals, “Kabanga Nickel Signs Framework Agreement,” 19 January 2021, www.lifezonemetals.com/kabanga-nickel-signs-framework-agreement.
-
129
Thomas Scurfield and Silas Olan’g, “Magufuli Seeks the Right Balance for Tanzania’s Mining Fiscal Regime,” NRGI, 31 January 2019, www.resourcegovernance.org/blog/magufuli-seeks-right-balance-tanzania-mining-fiscal; Thomas Scurfield, “Tanzania Strikes a Better Balance with its Mining Fiscal Regime,” NRGI, 24 June 2020, www.resourcegovernance.org/blog/tanzania-strikes-better-balance-mining-fiscal-regime.
-
130
This framework agreement was published in a document setting out Barrick’s offer to buy the shares it did not already own in Acacia Mining, the previous owner of the Bulyanhulu, Buzwagi and North Mara mines in Tanzania. See Acacia Mining and Barrick Gold, Recommended Final Offer for Acacia Mining Plc by Barrick Gold Corporation, 2019, 66–79, s25.q4cdn.com/322814910/files/doc_downloads/acacia/Acacia-2.7-announcement.pdf.
-
131
The main revenue streams are import duty, skills development levy, royalty, corporate income tax, a share of dividends and shareholder loan repayments through state equity, and dividend withholding tax.
-
132
The earlier in time a shilling (Tanzania’s official currency unit) is received, the more it is worth. This is, first, because it can be used earlier; and second, because the future is uncertain, and no one can be sure they will receive that shilling in the future. To account for this time value of money, a “discount rate” is applied. In the sharing arrangement, this would mean that if the government received a shilling in year 1, the company would need to receive more than a shilling in year 2 for the benefits to be comparable. However, given cumulation here is based on actual cash flow, the company would need to receive only a shilling in year 2 for the benefits to be shared equally.
-
133
This provision for the company to earn its minimum return before sharing is triggered means Ecuador’s mechanism is similar to an R-based cash flow tax, commonly referred to as a Brown Tax. See, e.g., Robin Broadway and Michael Keen, “Theoretical perspectives on resource tax design,” in The Taxation of Petroleum and Minerals: Principles, Problems and Practice, edited by Philip Daniel, Michael Keen and Charles McPherson (Oxford: Routledge, 2010), 13–74.
-
134
Prices are taken from World Bank, “Commodities Price Data (The Pink Sheet),” www.worldbank.org/en/research/commodity-markets.
-
135
With a gold price of $1,600 per ounce.
-
136
With a gold price of $1,600 per ounce.
-
137
With a gold price of $1,600 per ounce.
-
138
The Fraser Institute survey estimates that, unless there are extremely harmful policies, around 60 percent of an investment decision tends to be based on a country’s geology. The other 40 percent comprises of several other factors, including political stability and policy predictability (given they affect the risk that investors will not be able to secure future returns generated by their investments), a conducive business environment and the tax level. See Julio Mejia and Elmira Aliakbari, Fraser Institute Annual Survey of Mining Companies 2022, (Fraser Institute, 2023), 8, www.fraserinstitute.org/studies/annual-survey-of-mining-companies-2022.
-
139
However, information gaps make it difficult for taxes to be structured to capture all excess profit. See Jean-Franҫois Wen, Progressive Taxation of Extractive Resources as Second-Best Optimal Policy (International Monetary Fund, 2018), www.imf.org/en/Publications/WP/Issues/2018/06/13/Progressive-Taxation-of-Extractive-Resources-as-Second-Best-Optimal-Policy-45923.
-
140
Recent research provides a sense of the potential revenue loss to governments from tax avoidance. The International Monetary Fund recently estimated that sub-Saharan African mining countries could be losing between $450 and $730 million in corporate income tax a year. See Sebastian Beer and Dan Devlin, Is There Money on the Table? Evidence on the Magnitude of Profit Shifting in the Extractive Industries (International Monetary Fund, 2021), www.imf.org/en/Publications/WP/Issues/2021/01/15/Is-There-Money-on-the-Table-Evidence-on-the-Magnitude-of-Profit-Shifting-in-the-Extractive-49983.
-
141
It is perhaps surprising that Tanzania’s 50-50 sharing arrangement generates an AETR greater than 50 percent (with a discount rate of 10 percent). This is despite AETR measuring government take as the share of pre-tax profits, which is larger than “economic benefits” (given economic benefits exclude interest payments). This outcome results from the 50-50 split being based on actual cash flow. The government receives revenue before the mining company through input and production taxes that do not depend on the mine making a profit. Because of these earlier revenues, the government receives a larger share on a discounted basis.
-
142
As reported in the S&P Global database. Legal risks are “expropriation, state contract alteration and contract enforcement risks.” Tax risks are “tax increase and tax inconsistency risks.” Control Risks scores these risks as still “very high” and “high” respectively (following Tanzania’s overhaul of extractives sector laws and other actions against existing mines in 2017) but reducing.
-
143
With a discount rate of 10 percent. While Ecuador’s sharing mechanism does not account for the labor profit share because none of it will go to the government from 2024 onwards, I have included it in the AETR because it is a tax on the project. The Democratic Republic of Congo regime has an excess profits tax that is triggered for a mine when the realized price is at least 25 percent higher than the price in its feasibility study. I assumed that the feasibility study has a price of $1,300 per ounce, so the excess profits tax is not triggered.
-
144
Total benefits in this case are a project’s revenues minus operating costs and replacement capital (but not minus exploration and development capital). This cash flow represents the money available to pay back the initial investment and provide a return. The government share of it is a common measure of progressivity.
-
145
Wen, Progressive Taxation of Extractive Resources as Second-Best Optimal Policy.
-
146
With a discount rate of 10 percent. The results for only some countries are shown to clearly depict each data point. The results for all the evaluated countries can be found in my model.
-
147
Scurfield, “Tanzania Strikes a Better Balance with its Mining Fiscal Regime.”
-
148
This feature is not fully reflected in Figure 5 given that “total benefits” use a slightly different definition of profits and are based on discounted cash flows.
-
149
With a gold price of $1,600 per ounce.
-
150
For example, an average 62 percent of respondents to the Fraser Institute surveys between 2017 and 2019 said the current implementation of Tanzania’s legal system would strongly discourage investment, and 73 percent said regulatory uncertainty would. See, e.g., Ashley Stedman, Jairo Yunis and Elmira Aliakbari, Fraser Institute Annual Survey of Mining Companies 2019 (Fraser Institute, 2020), www.fraserinstitute.org/studies/annual-survey-of-mining-companies-2019.
-
151
With a low-profit mine and a gold price of $1,600 per ounce.
-
152
Tax avoidance could extend the Philippines’ recovery period, and therefore delay the payment of some taxes including import duty and interest withholding tax, given the end of the recovery period depends on the reported profitability of a mine rather than an ex-ante assessment. However, the rule that the recovery period must end five years from the start of production regardless of whether pre-production expenses have been recouped limits the extent to which it can be extended.
-
153
The merits of these measures require further scrutiny. E.g., taking a share of loan repayments could result in lenders charging a higher interest rate to ensure they still recoup their loan and a minimum return. This would not only reduce taxable income but also make it harder for the government to assess whether an interest rate is reasonable, because it would not be comparable with industry benchmarks. It can also be difficult for a government to always determine whether a loan is from a related party or not. However, these considerations are outside the scope of this analysis.
-
154
Natural Resource Governance Institute (NRGI), Natural Resource Charter, 2nd edition, 2014, resourcegovernance.org/analysis-tools/publications/natural-resource-charter-2nd-ed.
-
155
Although its exclusion of several significant taxes from the government’s share of benefits means low-profit mines may still be impacted.
-
156
With a gold price of $1,600 per ounce.
-
157
Anna Fleming, Thomas Lassourd and David Manley, “Variable Royalties: an Answer to Volatile Mineral Prices?” in Handbook on the Future of Resource Taxation, African Tax Administration Forum and Intergovernmental Forum on Mining, Minerals, Metals and Sustainable Development (forthcoming), www.iisd.org/publications/brief/future-resource-taxation-roadmap.
-
158
Ensuring that interest rates used as a comparison apply to comparable assets with a similar risk profile is challenging, but rules of this nature have been successful in reducing profit shifting in other countries. See Beer and Devlin, Is There Money on the Table?.
-
159
The main taxes listed are VAT, royalty and corporate income tax. The regime also includes a share of pre-tax profits that is currently divided between the company’s workers and the government, with the portion received by the government included in its accumulated benefits. However, a recent court ruling means that all this labor profit share will go to workers from the start of 2024 and therefore none of it will be included in government benefits.
-
160
The discount rate used is specific to each mine and based on its weighted average cost of capital (WACC). I have assumed that WACC is around 7 percent in real terms. This is based on the typical discount rate for equity shareholders used by industry and government analysts of 8 percent in real terms, and the current average cost of debt for the mining sector as reported by Aswath Damodaran, Damodaran Online, www.pages.stern.nyu.edu/~adamodar.
-
161
Republic of the Philippines, Financial or Technical Assistance Agreement, mgb.gov.ph/attachments/article/79/PFC_FTAA.pdf.
-
162
For example, some terms in the original FTAA for an OceanaGold mine differed in some areas: Republic of the Philippines, Financial or Technical Assistance Agreement with Arimco Mining Corporation, 1994, www.resourcecontracts.org/contract/ocds-591adf-2792396017. I understand that the recently signed extension to this agreement has slightly different terms again.
-
163
A template of the FARI model and a user guide that explains all the concepts and workings of the model are available at International Monetary Fund, “Fiscal Analysis of Resource Industries,”www.imf.org/external/np/fad/fari.